AotC - Cliff or Launchpad?
Welcome back!
This week has been a bit tumultuous in the market. Profits to be had, for sure, but only with a plan intact. This whipsawing can cause losses, which lead to emotional trading. Emotional trading leads to heavier losses. Heavy losses lead to negative self-talk, which typically leads to a complete inability to take action on the next run up due to paralysis-by-analysis (analyzing both the pros and cons so heavily you decide to take no action at all). Lets not get caught up in that…
How best not to, then? As I said above, a plan! Always be asking yourself upon entering a new trade: “Where on this chart would I know for sure that the market was telling me I was WRONG in that entry?”. Have a line in the sand, and stick to it. Exit for a small loss, even, as the mental capital you’re preserving by doing so will help you compound what you have left much more efficiently than having your heart sink every time you open TradingView and check your underwater position.
Lets get to it:
Total Market Cap - 6H - click to view:
I must say, I don’t care for the looks of this total crypto MC chart. We had a Double-top formation, then a breakdown of support and are now re-testing the underside of said support with a bear-flag. That’s what it looks like at the moment. Going back to my, “Where are we WRONG on this?”, I’d say it’s just as important to have a line in the sand for when you’re RIGHT too, particularly when speaking of a bearish thesis. So where will the market prove we are RIGHT in thinking the above chart is truly a bear-flag? I would say if it breaks and closes over the 200EMA (green line). If it does this, I’ll be exiting literally everything and waiting to get back in on any show of market strength.
BTCUSD - 6H - click to view:
I had originally given two scenarios back in May after that horrible drop: (1) we trickle all the way down to a 3rd touch of the USTL (upward-sloping trendline) that is a very HTF line dating all the way back to March of 2020. That didn’t happen, and instead, we got scenario (2): We broke above EMAs and then cleanly broke out of the Expanding Wedge, recently re-testing it as new support. This is bullish.
However, it seems we are still at risk here, as we dropped once more on 9/8, and now seem to be correctively pulling back to the upside. An Impulse short followed by a corrective pullback long usually indicates the next move will be another impulse short. However, the fact that we broke long from the aforementioned Expanding Wedge is positive, and may counter this bear case. We will pay very close attention to this over the next week or two (I will include an update on this, even in my next TAking Requests episode, as it’s mission-critical).
BTCUSD - 6H - click to view:
A similar thing is in play right now for ETHUSD. Above we see that we have 2 major things to pay attention to (the red arrows): Will we get a corrective 3rd touch on the flag I perceive to be forming? If not and we run long, what will price do at this local high (Double-top area)?
I have outlined two cases, with my red line and green line. This is a make-or-break area for ETH. For this reason, I will also include an ETHUSD update in my very next episode, even if it’s just a quick update in TAking Requests.
CRVUSD - 6H - click to view:
CRV is in a massive, MASSIVE wedge/triangle. It started to form this since day one, and when this breaks, it’ll be an incredible run. Recently, we were in a sub-structure: an Expanding Wedge within the overall Triangle. We just broke long from that Expanding Wedge within the last 48h after price rejected the strong S/R zone (red rectangle). Price is now re-testing the top-side of this Expanding Wedge as new support, and will likely run to the upper bound of the parent structure (the overall wedge/triangle), which is appx. $3.85. Note the perfect recent rejection of 1.272 Fib Extension level before the recent pullback…. Fib Extensions work, and 1.272 is a very highly targeted level.
Reader Request: ROSEUSD - 6H - click to view:
Looks like we have (or had) a beautiful Triangle forming here, re-testing previous highs as new support. Unfortunately it seems that this just broke short in the last few hours. We’ll see if the $0.22 level holds; if we see a single 4H candle-close below $0.22, I’d be exiting any position on this pair. I’ve actually already exited a trade on this pair for breakeven as I didn’t like how it recently broke down, but $0.22 may act as strong support and keep it afloat.
Reader Request: SFPUSD - 6H - click to view:
Currently bearish. Corrective ascent after an Impulsive drop, and re-testing both the 50/200EMAs. Sell weakness, buy strength. What’s strength, you might ask? Break-and-retests of the yellow circles.
Reader Request: AVAXUSD - 1D - click to view:
AVAX looks pretty good on the Daily. A nice break above the two tops outlined with yellow arrows. The break is nice and clean on the 1D, but on the 4H and 6H timeframes, it’s not *as* clean, and has a false-break above, then a break back down, then a break back above. I don’t like seeing those corrective breaks on the lower timeframes - I like to see the clean break and intraday corrective re-test of the S/R that was just broken as new support. But AVAX still looks clean enough… I would expect it will come back down to re-test the 50 at some point, and form a type of Ascending Channel structure of sorts (outlined in the SS).
Reader Request: ATOMUSD - 1D - click to view:
I can say this with almost certainty: ATOM will run to a 3rd test of this USTL. It’s basically programmed. Price would not come this far without going for that 3rd test of the trendline formed from the prior two highs. It may consolidate before that test, or after it, but it’s headed there next in my expert opinion. Congrats on anyone who caught this nice move up over the last week or two.
Reader Request: ATAUSD - 6H - click to view:
Looks like ATA is headed to either a Double-Bottom or a 3rd touch on the lower-boundary of the overall structure (which is, admittedly, a Bull Flag). I’d say hold off on a buy here, as we just formed a Bear-Flag within the Bull-Flag, so I’d re-buy on a re-test of local bottom (double-bottom formation), or 3rd touch of the overall HTF flag.
That being said, re-entry on strength. What’s strength? Buy on break-and-retest of flag, if price evolves and that happens before the other two things I mentioned.
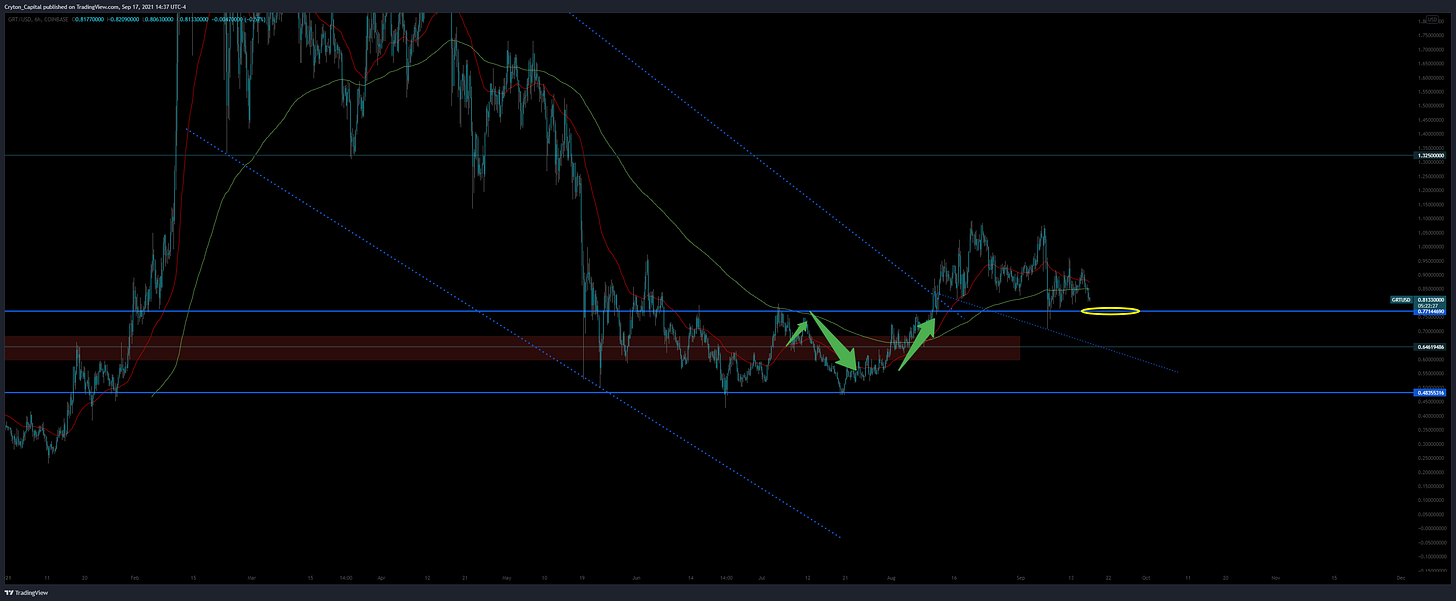
Reader Request: GRTUSD - 6H - click to view:
I will be buying on a double-bottom re-testing the strong S/R zone between $0.47 and $0.77. This is a very strong zone, and the upper bound of which will very likely hold price. If I see a strong (with high volume) break down into the S/R zone, I’d be selling for a loss; my line in the sand.
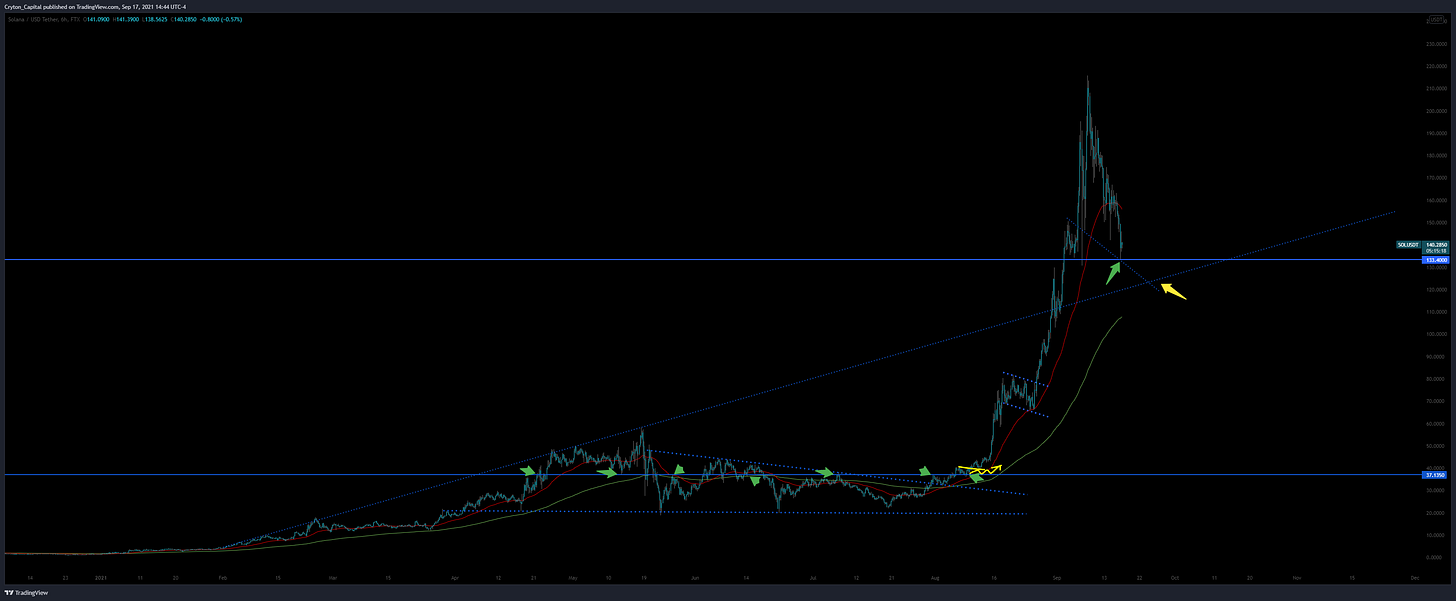
Reader Request: SOLUSD - 6H - click to view:
SOL looks like a buy here, but both “confluence” factors that are leading me to say this are inherently weak. When you have such a big move up, and into new airspace with no historical PA reference points, you are forced to go on weak factors. I called the move up (yellow corrective bounce off EMAs), and now a scale in (if already in profit) would be perfectly fine. If buying for the first time, I’d personally be cautious at these highs, but a small DCA-level entry would be fine here.
Personal trades
I’m still Long $SPELL, which is looking like a continued good buy here:
We were stuck within a corrective sideways channel for some time, but just within the last 48h have broken long from that, re-tested it as new support, and look ready to pop into price discovery. I am buying more here.
I am also DCAing into more FLURRY, which is a project that aims to simplify yield farming, removing gas fees associated from having to do all the legwork yourself, and instead, simply staking their token to farm multiple pools.
Thanks
…for your requests, and for your readership! I appreciate you all, and enjoy your feedback. Yes, I read every last comment… Keep them coming!
I’m still overall bullish on crypto for the remainder of the year, but think there will be an increase of random spikes / wicks / on various pairs during this final leg up. Q4 should be huge, but not without it’s traps.
Keep yourself protected, and keep an eye open for new opportunities!
Until next time…
Disclaimer:
Cryton Capital is not a registered investment advisor, legal advisor, tax advisor, or broker/dealer. All investment / financial opinions expressed in any-and-all posts on this page, including screenshots & captions, are from the personal research and experience of the owner, and are intended to be interpreted as educational material only. Although best efforts are made to ensure that all financial charts and commentary are as up-to-date as possible, there may be times where price moves beyond key levels before the chart can be posted. Alas, this is part of the fast-paced financial sector and cannot be avoided. Also, occasionally unintended errors and/or misprints may occur.
Follow Me.
Learn how to earn…
Become part of our community.
Follow our socials.
Subscribe to our podcast.
Subscribe to this publication.
It’s free (for now)


First of all, thank you very much. I asked for the Rose analysis, and you did it. You are wonderful. In these analyzes, I was more interested in 3 things.
The first is the BTC chart. It's not good enough. I would have expected it to be calmer and more reassuring.
The second one is SOL. Network usage has exceeded the limit. And the transfers stopped for a long time. When the same situation happened for avax, the results were very different. It's a hype. But it's not a balloon. But the team urgently needs to find a permanent solution.
Finally, AVAX. He made a nice rise with the surprise investment he received. Even in decline, it retained its value.
I am very hopeful about AVAX. I think it will upset the charts.
Thank you again for your analysis.
Have a nice day.
I've been following it for about a year and I noticed this. There are times of retest. He's hitting it up and down all the time. Zigzag. That's the kind of time we're in right now.
I don't like buying and selling with a 10% profit. I like to take it and wait. A good opportunity for those who trade by taking small profits in a short time. Or for those who are engaged in futures trading.
Thanks for the nice analysis.