AotC - The Pause before the Storm
Welcome back!
This week & last we’re seeing a bit of a pullback on crypto market-wide. Will it persist? Unlikely. Don’t let talk of Novembear get you down. Let’s dig in as to where we’re at in the bigger picture:
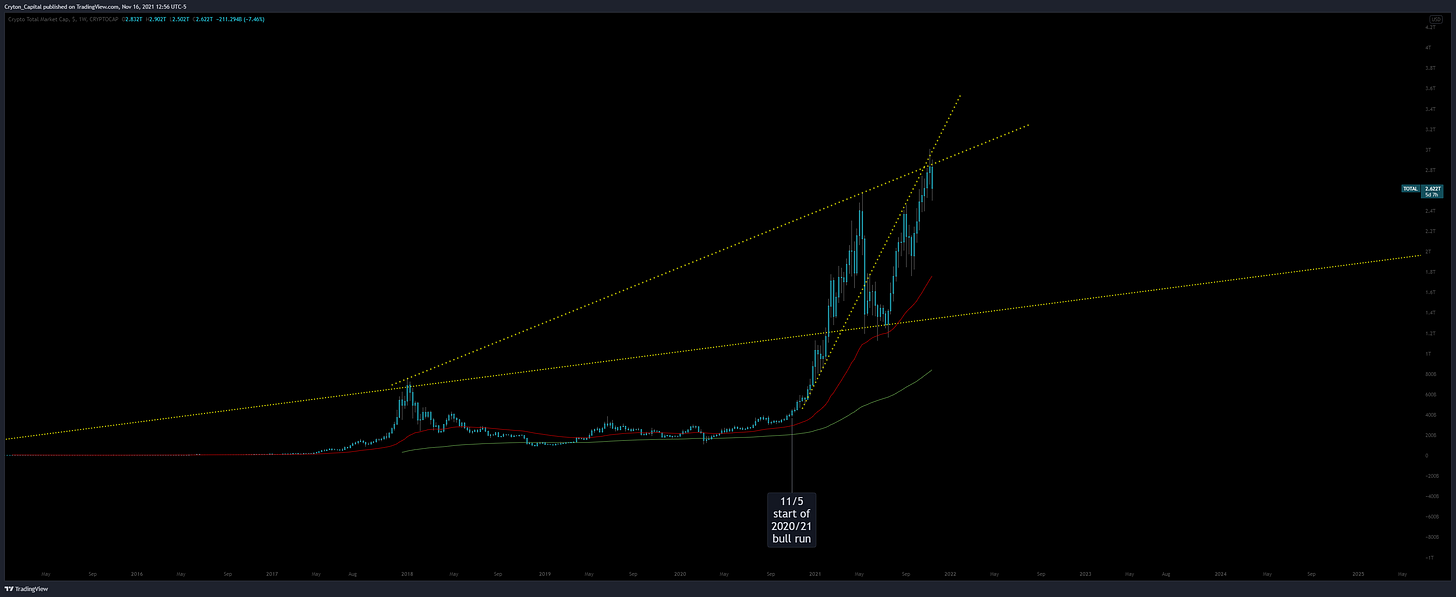
Total Market Cap - 1W - click to view:
I will be the first to admit, the TotalMC chart above does not look good. Not only are we rejecting a key Trendline after moving beyond previous ATH, but we’re rejecting the intersection of two key Trendlines, with the rejection of the most prominent one also being the third touch! Yikes. Lets zoom in:
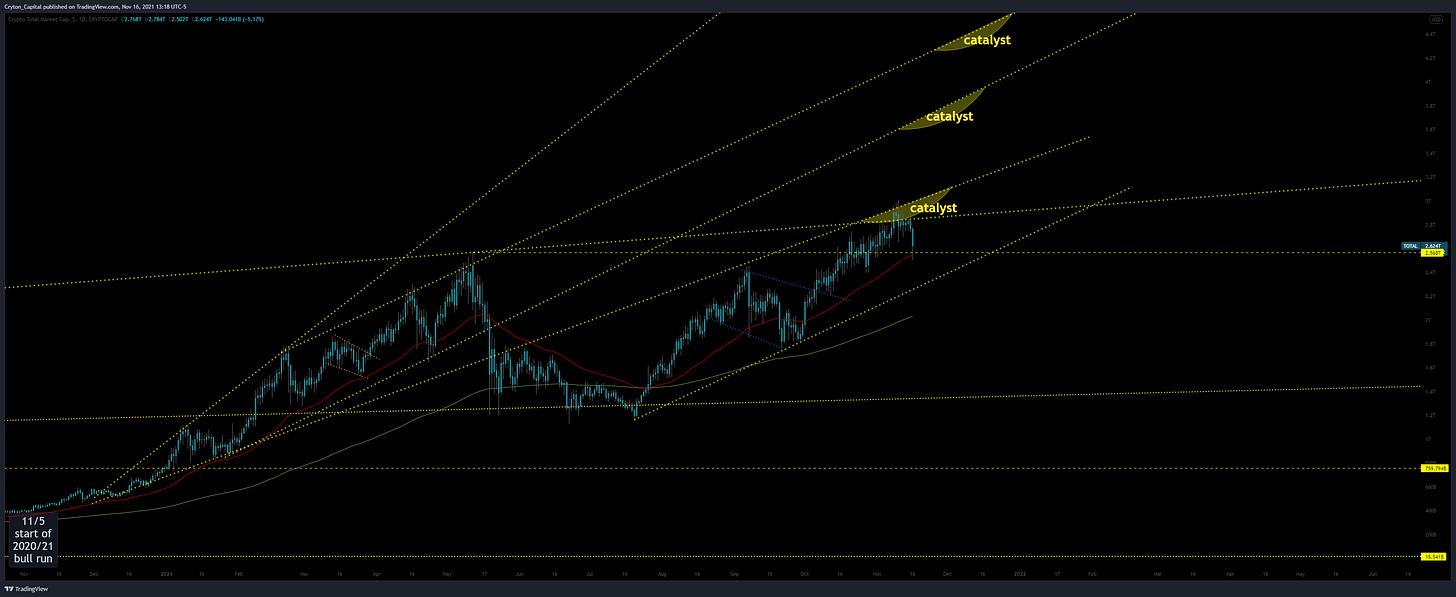
Total Market Cap - 1D - click to view:
The catalysts listed in the above screenshot were outlined perfectly, well in advance, in my previous episode released Oct 22. The catalyst we just hit was pre-drawn, although I was missing a Trendline that’s stood out to me & been added since. All that to say: this was expected. Here is an excerpt from my Oct 22nd episode: “You can expect market-wide pullbacks around these outlined (catalyst) areas, before the run resumes. If you’re daring enough to trade, these are opportunities. For the vast majority? I would recommend the set-and-forget method.”
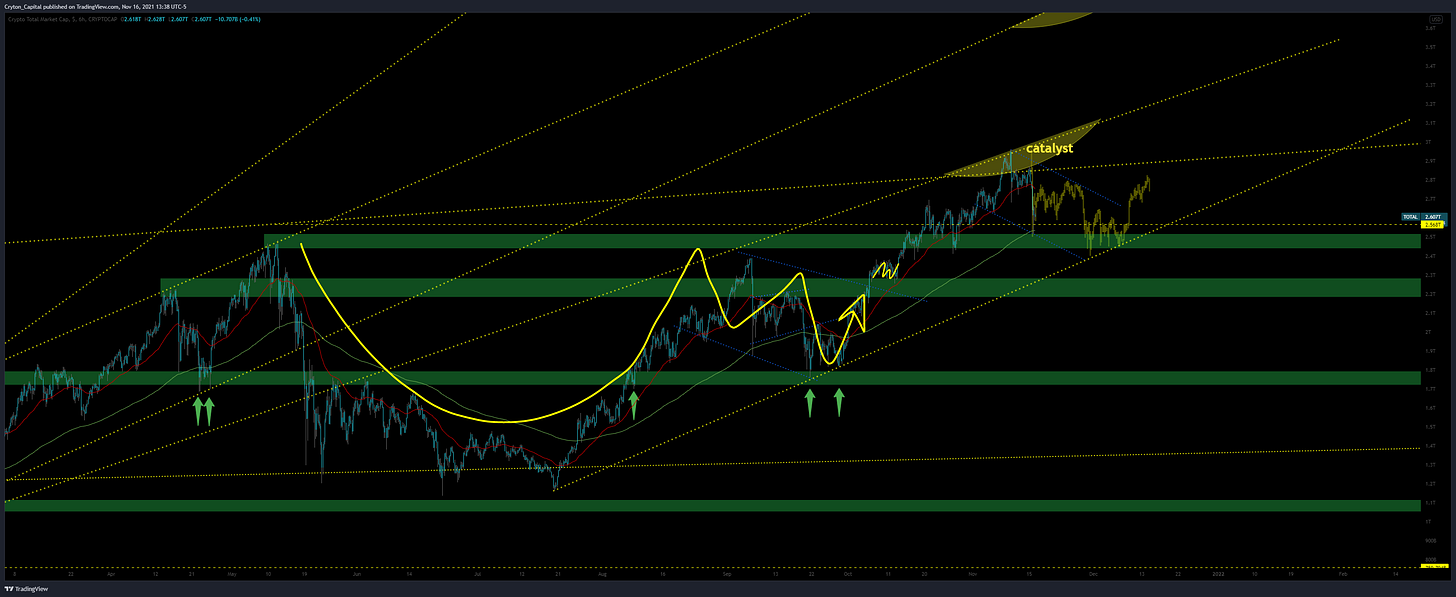
Let’s zoom in further:
This is how I expect this will play out. A break below that outermost “retaining” Trendline, and I’d convert bearish for the medium-term. Otherwise, nothing to worry about.
Practice: how many similarities in price-patterns can you spot in the SS above?
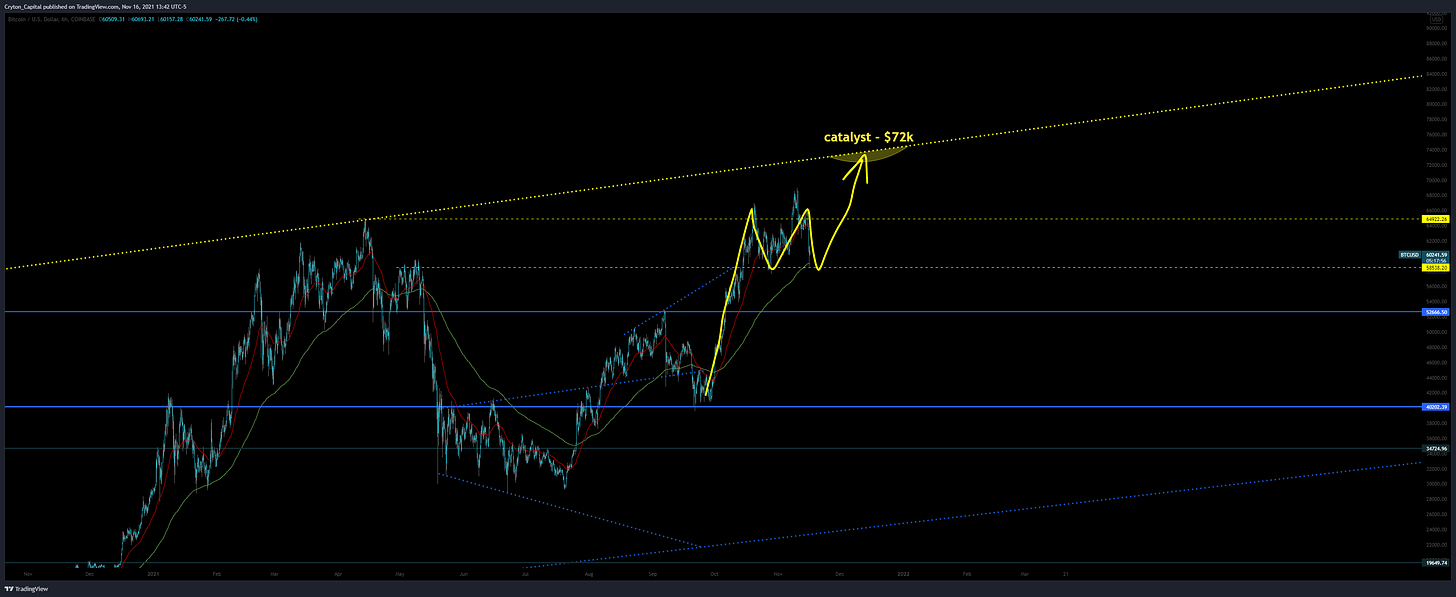
BTCUSD - 6H - click to view:
BTCUSD fairly unaffected by this pullback. This is just standard PA playing out here, with price completing a consolidative period after reaching new highs. I don’t expect any pullback (even a wick) below $56k. $72k incoming very shortly. Hopefully that won’t stomp the alt-market too badly. Lets check the Alt Index:
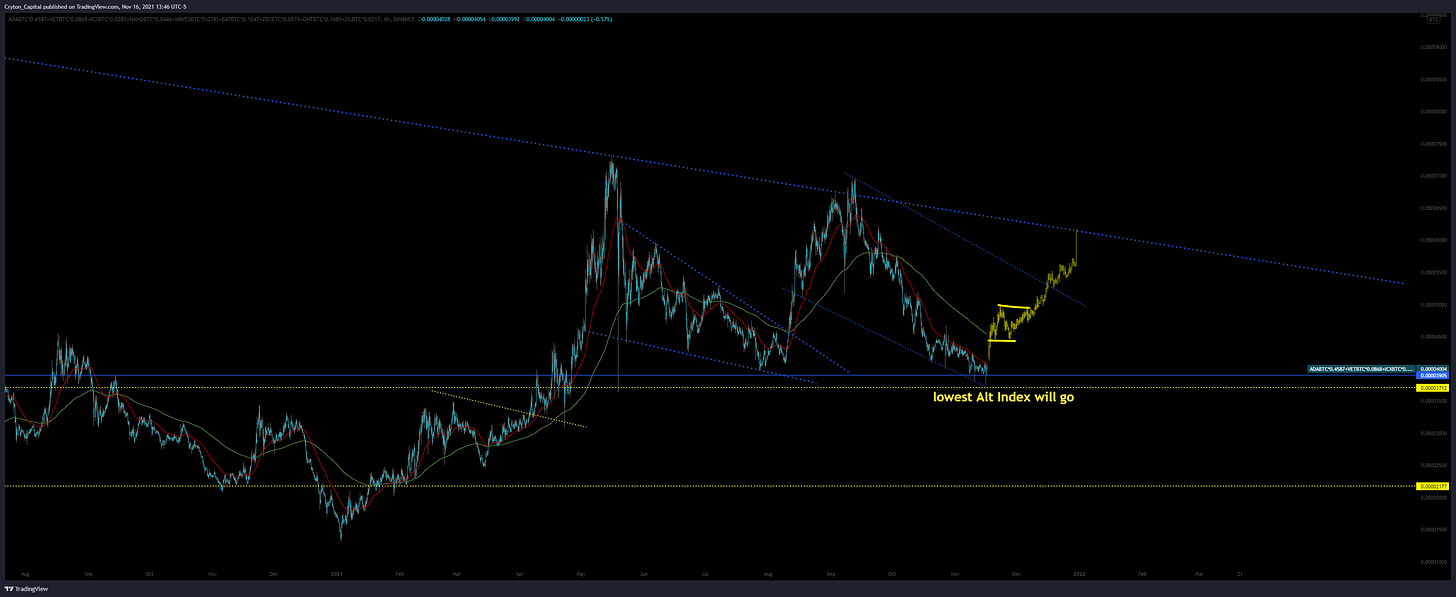
Alt Index - 6H - click to view:
I stand by my original call for the floor of the Alt Mkt, outlined above. Admittedly, we’re getting close to it now, but I believe this entire segment of PA is just a massive Bull Flag (more visible looking at the SS above without clicking it, for most zoomed-out view). I think we’ll print a reversal very soon, and alt mkt will follow something similar to the yellow line above.
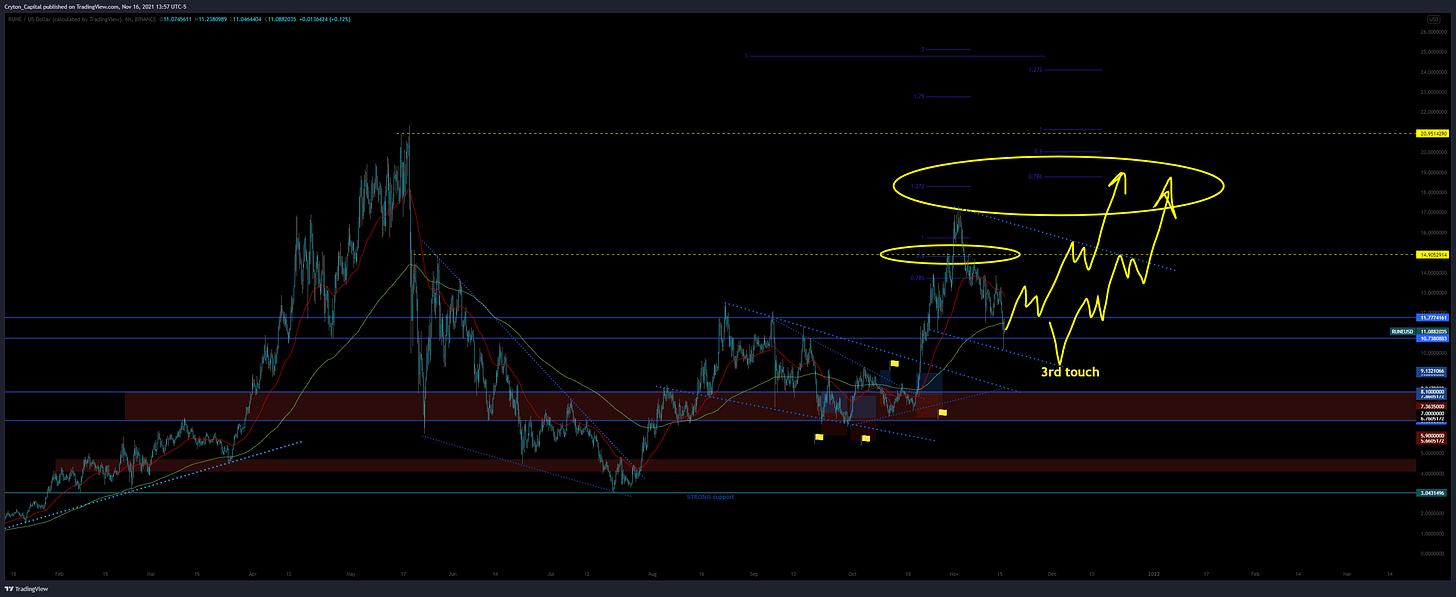
RUNEUSD - 6H - click to view:
RUNE has suffered yet another setback with nodes recently ceasing to be able to reach a consensus on chain state, thus resulting in another full halt. I don’t even think the majority know ThorChain is halted right now though, unless you’re paying close attention. The chain should be back online within 48 hours, and another bug squashed / fix implemented. Nine Realms Capital and Qi Capital are both providing tremendous resources to get ThorChain beefed up and running smoothly. I believe that in the end, it is literally impossible for the network not to be considered a raging success. These things just take time, and I don’t know of a single project that is doing with native assets what ThorChain is doing, therefore I continue to be bullish regardless of roadblocks. You can see where my orders were clustered in the SS above, outlined to you all in AotC as I took them, so I’m still well in profit and am literally just sitting this one out (AKA, not selling). Neither have I bought here, as I am comfortable with my entry price & sitting in spot. If you have yet to attain any RUNE, this remains a great value area, however. Previous high has yet to even be re-attained, and when we break into price discovery once more, and with all liquidity caps removed this time, I think there will be some serious fireworks…
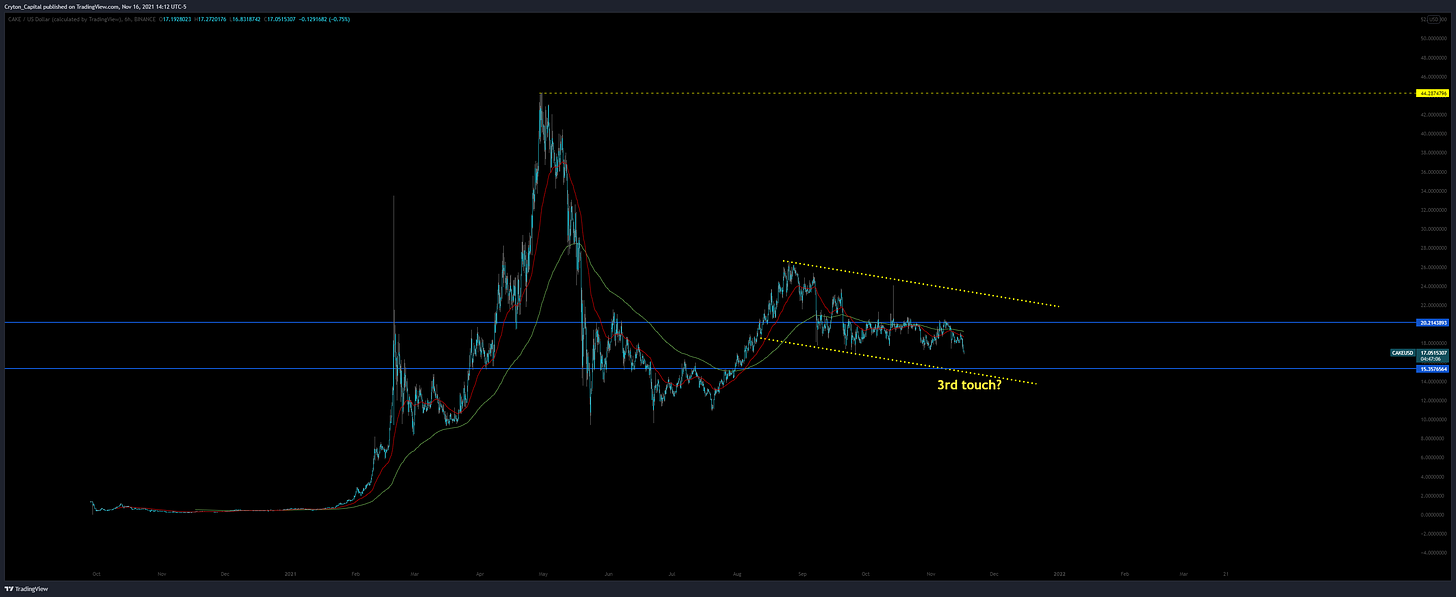
Reader Request - CAKEUSD - 6H - click to view:
In the above reader-requested pair, it looks like we’re headed for a 3rd touch on this nice corrective Bull Flag. This is a value area as it’s quite a flat Flag, and we’re already nearing the bottom boundary. I see this going back to ATH shortly thereafter. Fib Ext. supports this thesis as well.
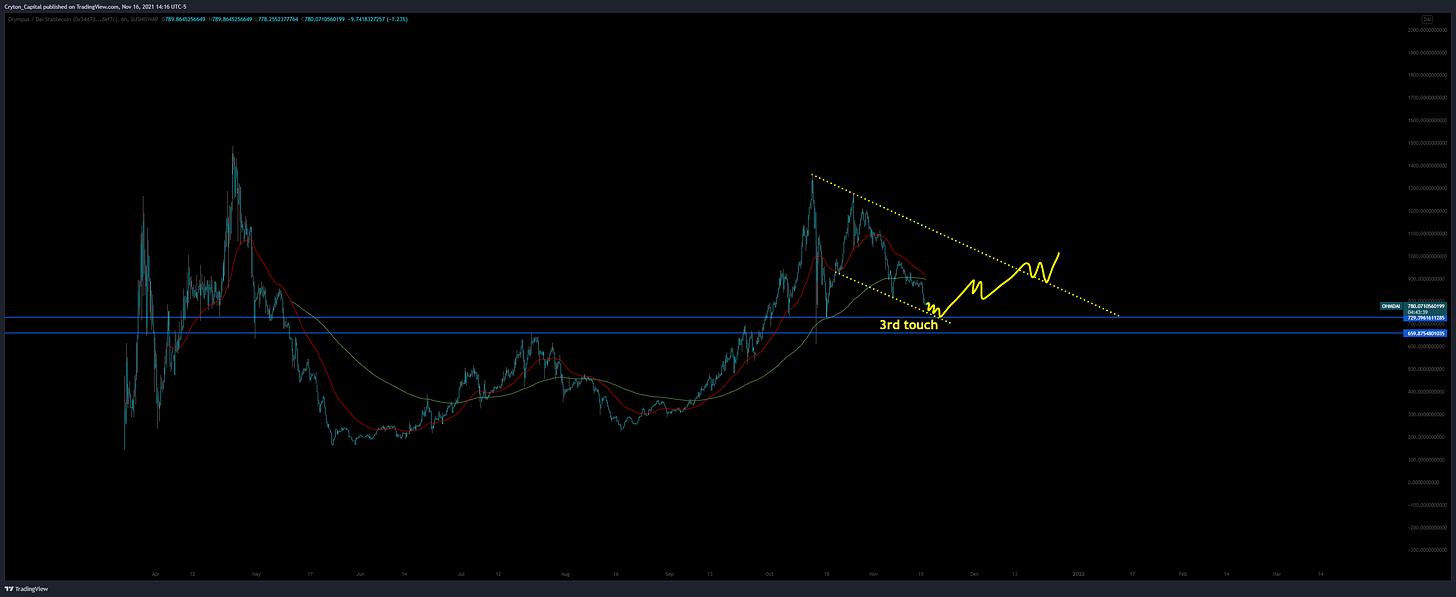
Reader Request - OHMDAI - 6H - click to view:
For OHM, we’re also in an excellent value area. I think we’ll get a very tight little trickle down to a 3rd touch on the lower boundary of the overall Flag, re-testing previous support zone at the same time, then a run up above EMAs. Toss in a brief pause to re-test those with yet anther mini-flag before breaking long (or at the very least re-testing the upper boundary of the Bull Flag) and that is my thesis for now.
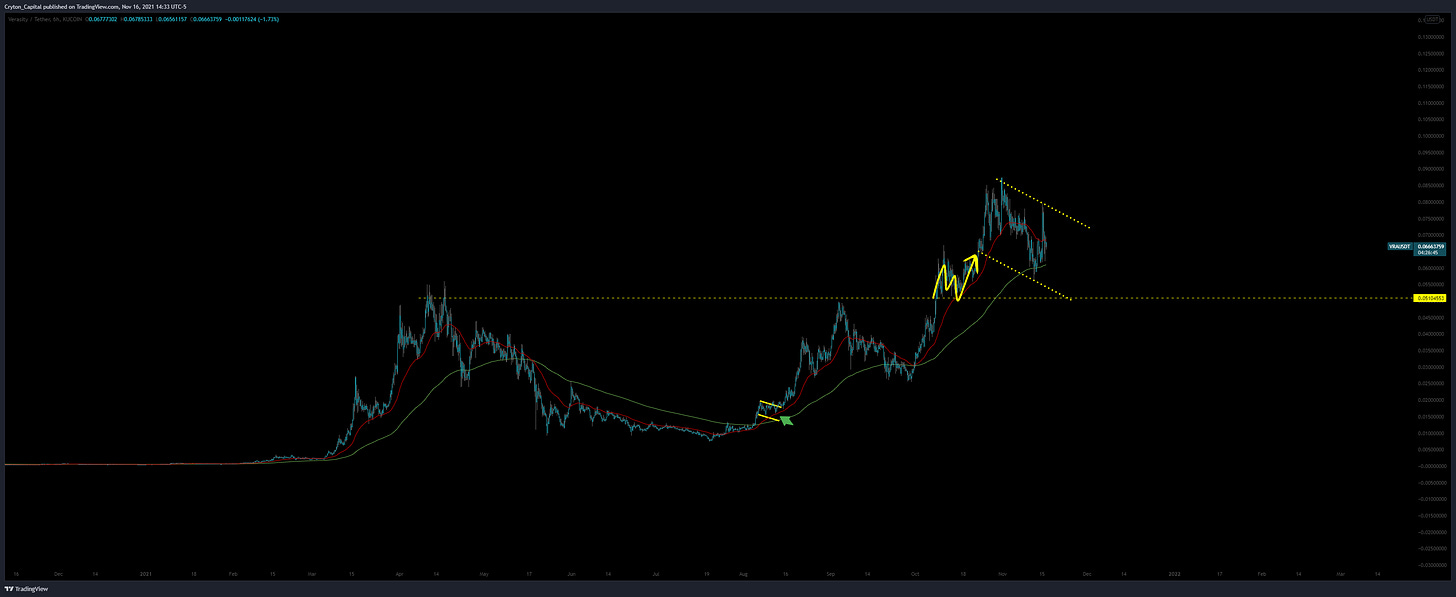
Reader Request - VRAUSD - 6H - click to view:
As I outlined in my last full episode of AotC, I figured we’d get a strong pump off the re-test of the previous high, and we did. Now we look to be in another Flag, but I’m not entirely sure where we’re going from here as the next logical step for a flag of this size would be yet another re-test of the ray-line from previous ATH. If we get that, it may dampen expectations of buyers as it could be viewed as a failed pattern due to limited price progression, but I could be wrong. Best thing to do would be to watch how price moves over the coming week: Correctively or Impulsively? If it sort of “trickles” down to a 3rd touch at the intersection of the flag and the ray-line, that would bring me back around to a bullish expectation.
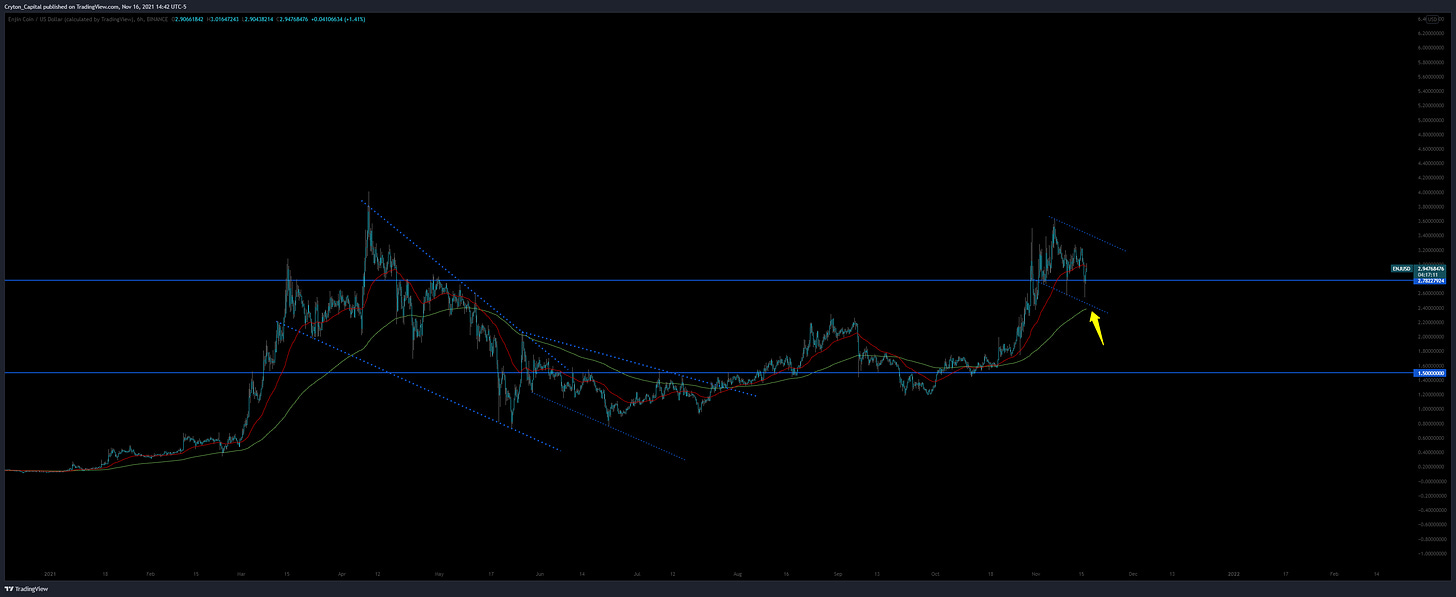
Reader Request - ENJUSD - 6H - click to view:
ENJ looking nice here with a re-test of a key S/R level. I would consider this a value area. My only qualm here is, I would have liked to see a re-test of the EMAs. We may still get this, if we get another wicky spike to flush out more Stops before bull cycle resumes. Be aware.
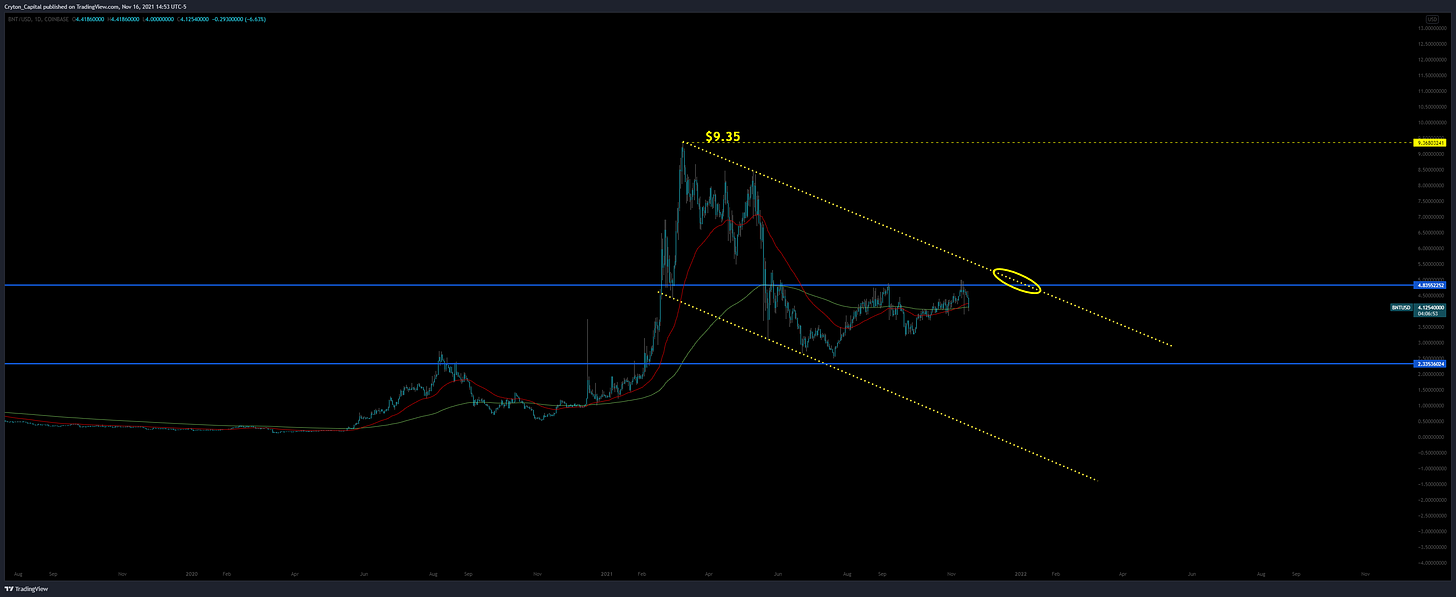
Reader Request - BNTUSD - 1D - click to view:
BNT looking pretty stuck here - lots of sideways chop, and a major pending catalyst of the rejection of the upper-boundary of this Descending Channel. I would not recommend any buy on this pair as I don’t see current price as any form of value. Value area would be another re-test of the $2.65 area, or a break above the entire channel, and a buy at the re-test of it as new support (AKA, a show of strength).
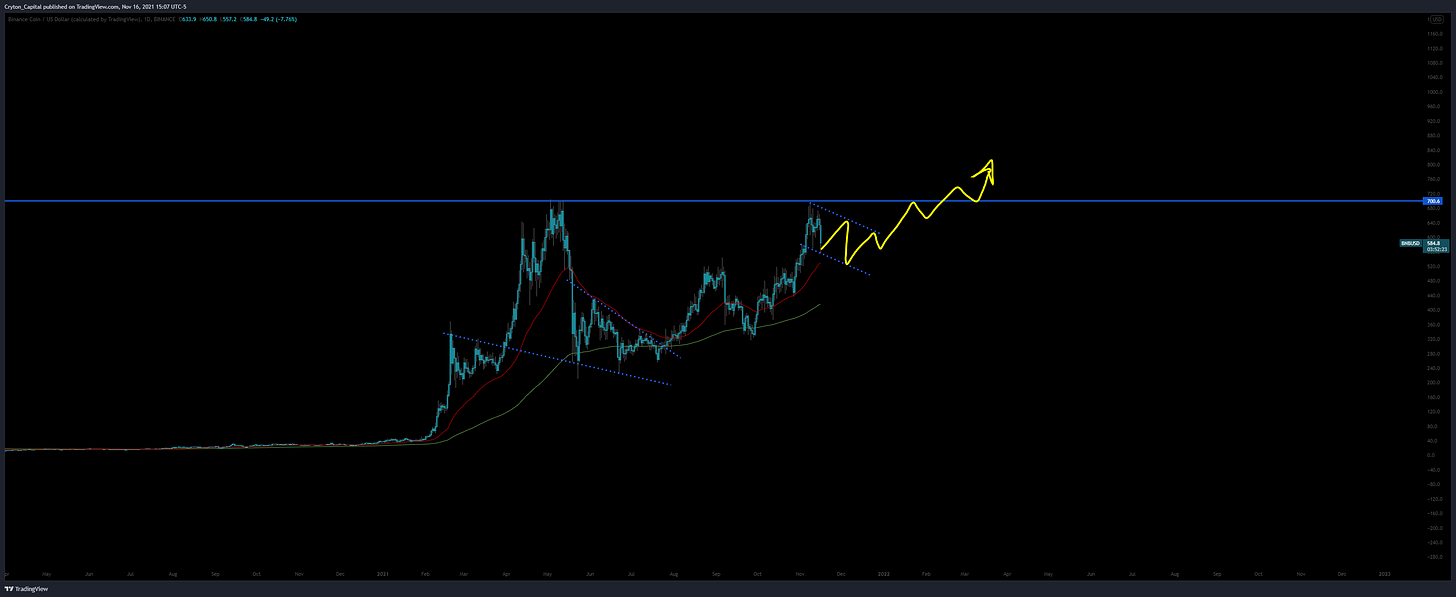
Reader Request - BNBUSD - 1D - click to view:
BNB not looking great here either. JUST re-hit previous ATH, and with this dip, that may end up sending it into a spiral for a bit. There is always some form of FUD surrounding BNB, too, which doesn’t help. For now, concentrate on what it’s doing in this little flag area I’ve drawn in. This flag is brand new, so might not complete until mid-Dec. We’ll have to re-visit this one, but the rejection from previous ATH is absolute. Take half profits here, in my opinion, and wait for the flag to solidify before you make a further decision for your bag.
Summary:
The PA on these charts have built themselves into an area where they have a significant amount of freedom to do whatever they damn well please for the next few weeks. Unfortunately, if you’re holding most (except those specifically mentioned otherwise), we’re too low to sell, and too high to buy. We’re in a purgatory of sorts. We could see more consolidation through till mid Dec. waiting for these flags to complete, but also could break long for the pairs that look to be nearing completion, or break short from the patterns that are just “trickling” up forming Corrective Ascending Channels. The bearish pullback of these last 2 weeks has been hurting many, as we had finally seemed to be getting fresh air above previous highs, which caused lots of new positions to be taken in the confidence that gave people. Some pairs such as RUNE haven’t even re-achieved previous high though, which reminds us just how much headroom we still have for this bull cycle. That, and the Total MC still being shy of $3T… That is a market cap for ants.
My suggestion for you all is: spot only. No leverage. De-lever some of your position(s) if you’re already levered. Ensure you’re COMFORTABLE. If you’re feeling UNcomfortable, do what you need to get back into a position of comfort where you can just ride these waves out, then re-approach the market from a position of STRENGTH. We have the most volatile part of the bull market remaining, as I’ve said many times, but that doesn’t necessarily mean straight up… It can mean routine 15-20% pullbacks as well! “Strength” means you’re prepared for any outcome. Is that you?
Stay safe, get comfortable, settle in for a bit longer, and we will re-assess ASAP!
Have a great week ahead :}
CC
Disclaimer:
Cryton Capital is not a registered investment advisor, legal advisor, tax advisor, or broker/dealer. All investment / financial opinions expressed in any-and-all posts on this page, including screenshots & captions, are from the personal research and experience of the owner, and are intended to be interpreted as educational material only. Although best efforts are made to ensure that all financial charts and commentary are as up-to-date as possible, there may be times where price moves beyond key levels before the chart can be posted. Alas, this is part of the fast-paced financial sector and cannot be avoided. Also, occasionally unintended errors and/or misprints may occur.
Follow Me.
Learn how to earn…
Become part of our community.
Follow our socials.
Subscribe to our podcast.
Subscribe to this publication.
It’s free (for now)


Thank you very much for that analysis that comes like medicine when I need it.
Very reassuring analysis as always. Thanks a lot, have a great week.