


Bitcoin has been on fire since my last article Bitcoin Price Update 08/05/2021 make sure to read it first to see how the market reacted over the past two weeks.
Let’s start with the chart analysis as I always do. I first show the charts from my previous article and discuss how the price reacted and then give my opinion on where I think the market will go in the future.
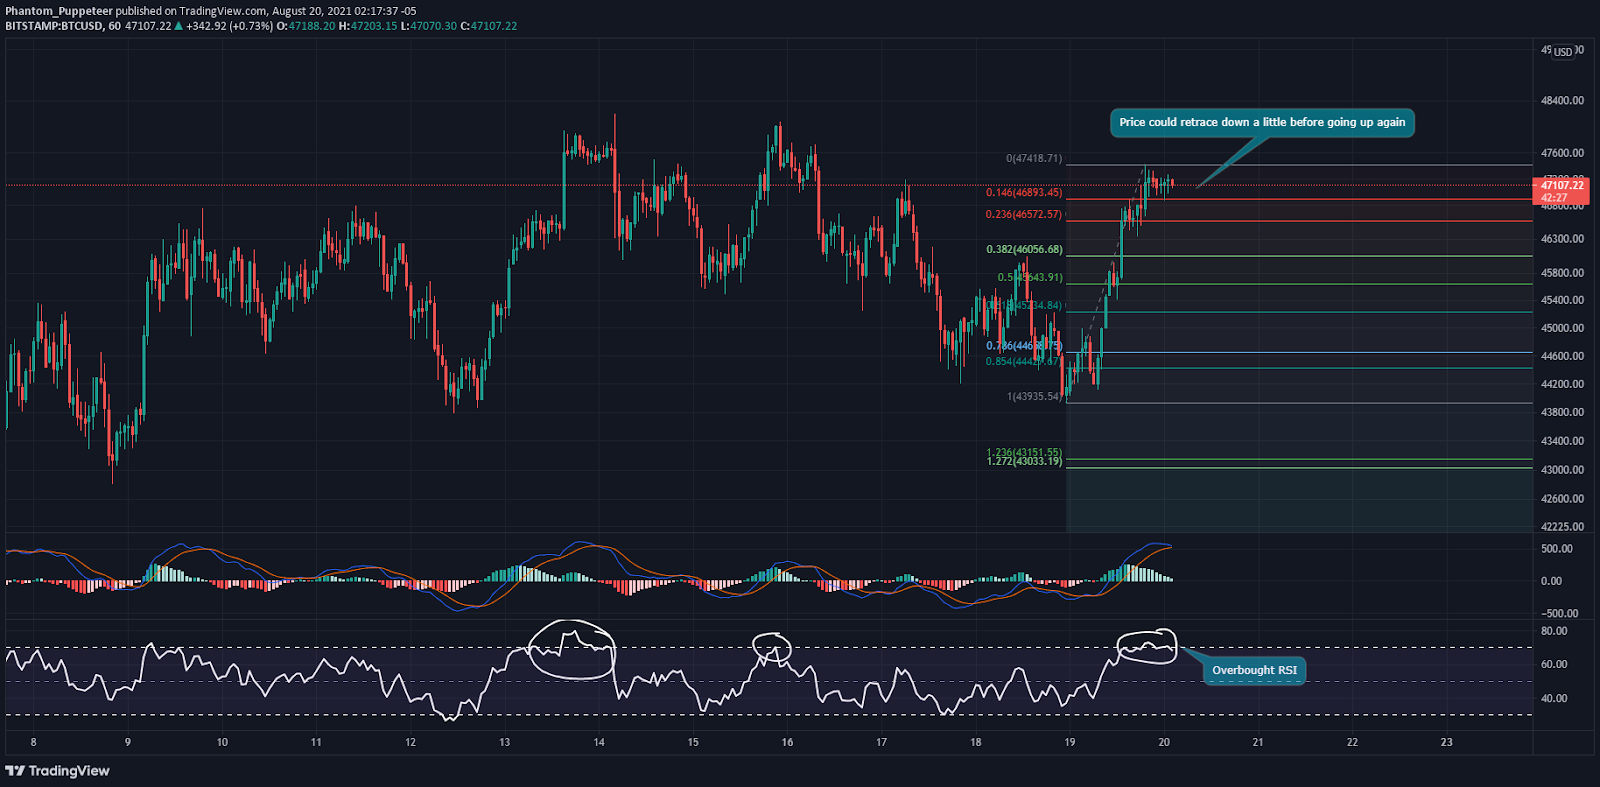
BTCUSD - 1H Chart (Click to View)
Looking at the hourly chart from my previous article, Bitcoin was going up as expected after it broke out of the bullish squeeze formation and got rejected at the strong resistance at 41,341 USD and was ready to continue going up towards 46,000 USD:

Now two weeks later:

As can be seen above, price continued to surge past the strong resistance at 41,341 USD and achieved the minimum target at 46,000 USD.
Zooming into the chart we can see that relative strength index, RSI is overbought and it might cause more selling pressure on Bitcoin price on the short term:
BTCUSD - 4H Chart (Click to View)
Now moving on to the 4H chart, from last article, price has been moving in a falling channel:

So far, we are still going up after breaking out of the falling channel. Also, looking at RSI and MACD indicators they show bullish momentum building up. Price has yet to go up above 50,000 USD in the near future:

BTCUSD - 12H Chart (Click to View)
The 12H chart remains bullish above the 50% channel retracement since the last article. I still believe it has the potential to go beyond all time high towards 100,000 USD. There are no updates on the chart:

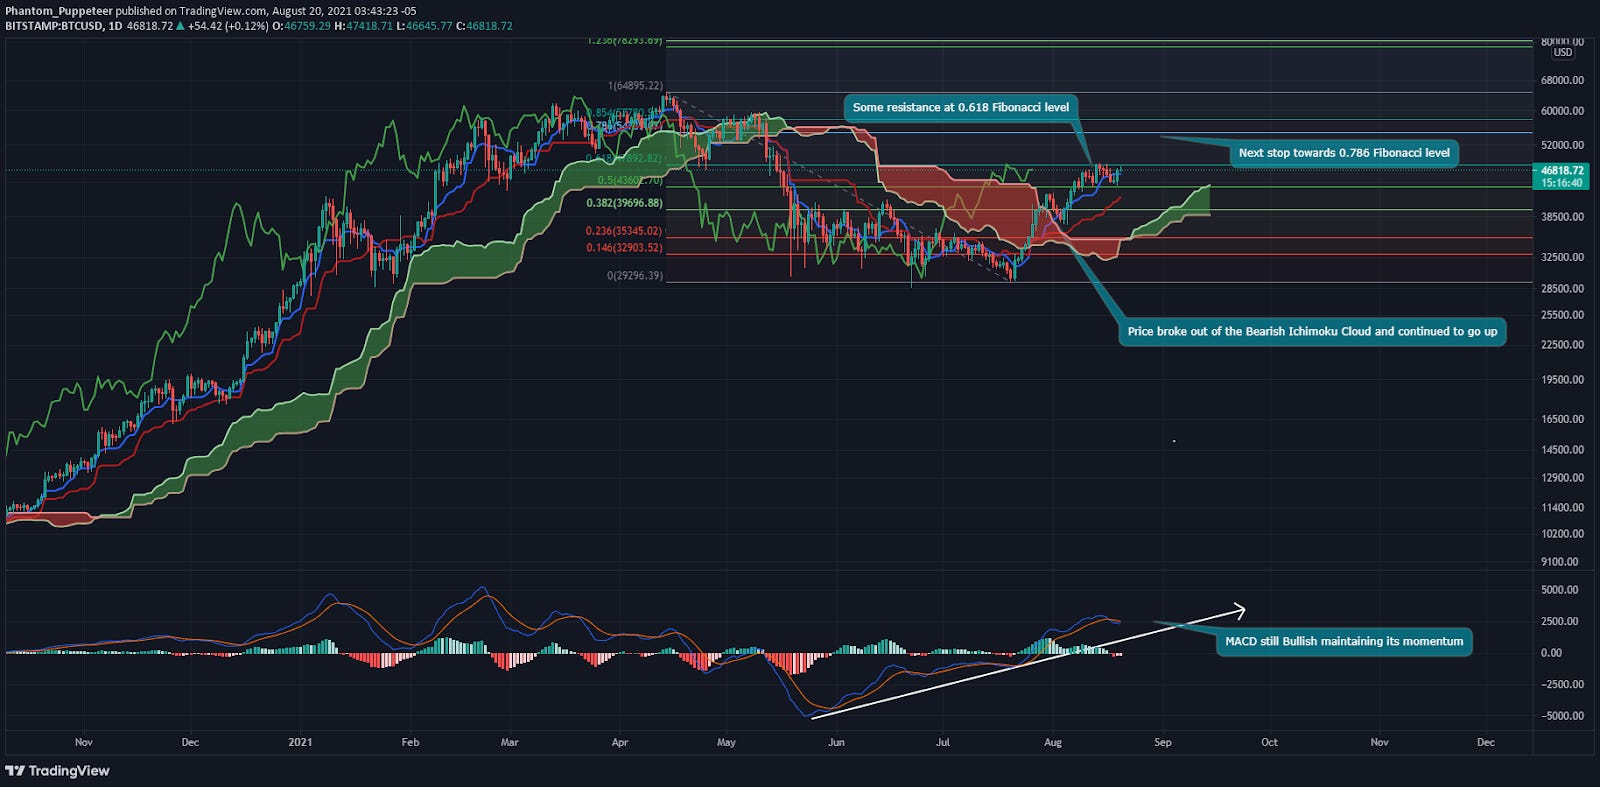
BTCUSD - 1D Chart (Click to View)
Looking at the daily chart of the last article we can see how price continued to surge upward after breaking out of the Ichimoku Cloud and as long as price is above the cloud we remain bullish on the daily chart. MACD indicator crossed the 0 line to go in the bullish zone as shown below:

Now two weeks later price found resistance at the 0.618 Fibonacci level. This level has to break to resume going up to 0.786 level which should be around same target as that in the 4H chart.
BTCUSD - 1W Chart (Click to View)
The weekly chart remains bullish since it found good support at the 50 MA. The MACD indicator is close to the 0 mark and the fast MA line is crossing above the slower one which indicates the continuation of the uptrend:


So to sum it up, my overall sentiment on Bitcoin is still bullish. On short term there might be a correction on the hourly chart but it shouldn’t last since the 4H chart is still bullish and has to go beyond 50,000 USD. 12H chart remains bullish above the 50% channel retracement level. Daily chart is still bullish above the Ichimoku Cloud. Finally, the weekly chart still on strong support at the 50 MA and MACD is showing bullish crossing.
Disclaimer:
Phantom Puppeteer is not a registered investment advisor, legal advisor, tax advisor, or broker / dealer. All investment / financial opinions expressed in any-and-all posts on this page, including screenshots & captions, are from the personal research and experience of the owner, Phantom Puppeteer, and are intended to be interpreted as educational material only. Although best efforts are made to ensure that all financial charts and commentary are as up-to-date as possible, there may be times where price moves beyond key levels before the chart can be posted. Alas, this is part of the fast-paced financial sector and cannot be avoided. Also, occasionally unintended errors and/or misprints may occur.
Find me on Twitter:
Learn how to earn…
Become part of our community.
Follow our socials.
Subscribe to our podcast.
Subscribe to this publication.
It’s free (for now)
Thanks for your technical analysis. In order for the conditions to improve, it is necessary to exceed USD 50,000 in a short time.
I would like to talk about a fundamental analysis I did today. It can leave a positive impact on the BTC price.
BlackRock, the world's largest asset management company, made huge investments in Bitcoin mining companies in the second quarter of this year. The company has just revealed that it has invested $382 million 962 million in Marathon Digital Holdings and Riot Blockchain, according to a June 30 U.S. Securities and Exchange Commission (SEC) document.
With this investment, BlackRock's share in Marathon was 6.71% and in Riot Blockchain 6.61%. According to details given by Forbes media, the asset management company spent $206 million on its investment in Marathon and $176 million on Riot. These figures are a huge investment for the companies themselves.
I appreciate BlackRock company. He first stepped into the cryptocurrency universe in 2019 by hiring Robert Mitchnick, Ripple's product marketing manager at the time. Mitchnick currently works under BlackRock and is the manager of distributed ledger technology and digital assets.
As it is known, after the closure of miners in China, the difficulty level in Bitcoin mining dropped to a record level. With the difficulty falling, the undisturbed miners, which got ahead of their competitors, mined more Bitcoin. In other words, it is obvious that both US-based companies benefited heavily from the bans in China and made a profit.
Bitcoin is now traded in the center of a nation that support it.
Thank you for reading. I wish you a good day.
I totally agree with you and I think these indicators will work.
I think we have an uptrend ahead of us.
The probability of a drop seems very low.
I believe that if we exceed forty-seven thousand, we can easily exceed fifty thousand.
Looking at the equality graph, I think there may be some correction, but if it exceeds forty-seven thousand, fifty thousand will be easily seen.
The Fibonacci levels are also bullish.
We can follow the definite resistance points that there will be an increase in general and make inferences.
Thanks for the article Phantom Puppeteer :)