I am Back from a week off from writing articles. As always, before we dive into the chart analysis I recommend you to read my previous article EOS Price Update 08/03/2021 to see how the market reacted over the course of the past two weeks.
For those who are reading my articles for the first time, I first start analyzing lower time frames zooming outwards to large timeframes to be able to spot short and long term potential movements in the market and to avoid any bias. Then, I will be looking at how EOS is performing against the two giant cryptos Bitcoin and Ethereum.
EOSUSD - 1H Charts (Click to View)
In my last article, EOS was trying to form a head and shoulders pattern on the hourly chart. The neckline break at 3.90 USD could have triggered selloff towards the 0.500 - 0.618 Fibonacci levels as shown below:
However, the price did maintain itself above the neckline and kept getting rejected for three times before launching higher towards the strong resistance at 4.37 USD breaking it and consolidating before continuing to go up as shown below:
Now let’s see where the price could go next. Price has been moving in a rising channel as shown in the chart below:
As long as the price keeps moving within the channel we remain bullish on the hourly chart. Notice at the end EOS has formed another head and shoulders pattern with the neckline (in yellow). If price were to break the neckline downwards then we can expect EOS to fall to the strong support around 4.60 USD. However, if the neckline holds then EOS will resume its bullish momentum towards 6.00 USD.
EOSUSD - 4H Charts: (Click to View)
Price on the 4H chart of the last article broke out of the falling wedge (Ending Diagonal) which is a strong reversal sign as shown below:
Price broke through the 4.43 USD resistance and its next stop should be around the next big resistance at 7.67 USD. Looking at other indicators such as RSI, it is holding strong around the 50 level which prevents the price from dropping and makes it continue to go up after every small dip. On the MACD indicator, we can see that it has been going up and following the price action. A bearish sign would be if the RSI dropped below the 50 mark which could make the price drop to the previous resistance level at 4.43 USD and turn it to a new support:
EOSUSD - 12H Charts (Click to View)
On the 12H chart, there doesn’t seem to be any update since as I mentioned in the previous article that we had a bullish divergence on MACD indicator and it broke above the 0 line:
EOSUSD - 1D Chart (Click to View)
I added the daily chart to this article since I noticed something interesting on the RSI indicator. As you can see here it is overbought and got rejected at previous levels where EOS had big selloffs which is a bearish sign. Also, price should maintain the 200 Moving Average in order for it to continue going up otherwise it will drop towards next strong support near 4.43 USD as shown below:
EOSUSD - 1W Charts (Click to View)
Now zooming out to the macro scale for EOSUSD in my first article (EOS Price Update 07/26/2021) I presented the following chart and how it was showing a good sign for reversal:
3 weeks later, price has gone up a lot away from the long term support trendline which could indicate the continuation of the macro uptrend towards previous high at 15 USD then all time high at 23 USD:
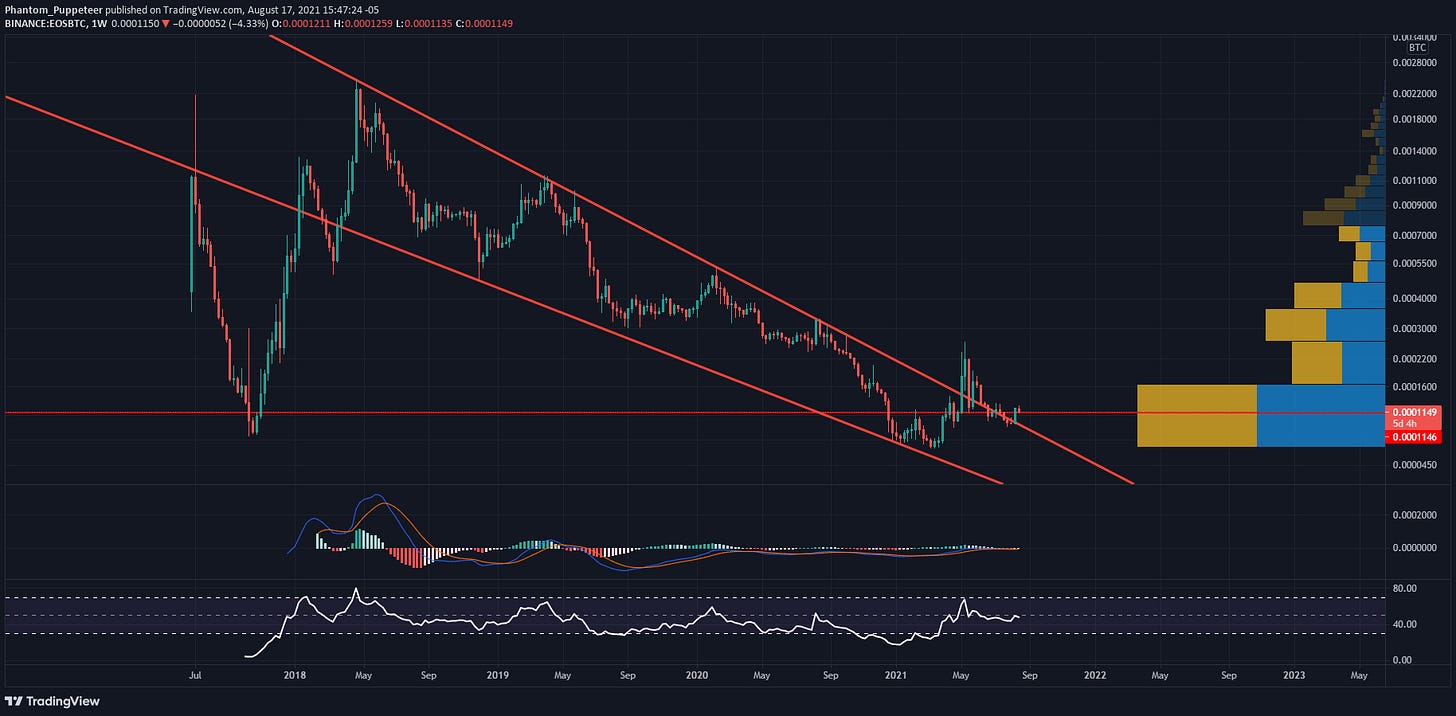
EOSBTC - 1W Charts (Click to View)
On my first article 3 weeks ago, I showed how EOSBTC broke out of the three years resistance line of the falling wedge formation:
Price was consolidating around the resistance trendline that turned into a support. Then, in the past week, EOSBTC went up which could indicate that the consolidation ended and price is ready to continue going up. We remain bullish on EOSBTC as long as it is above the support trendline:
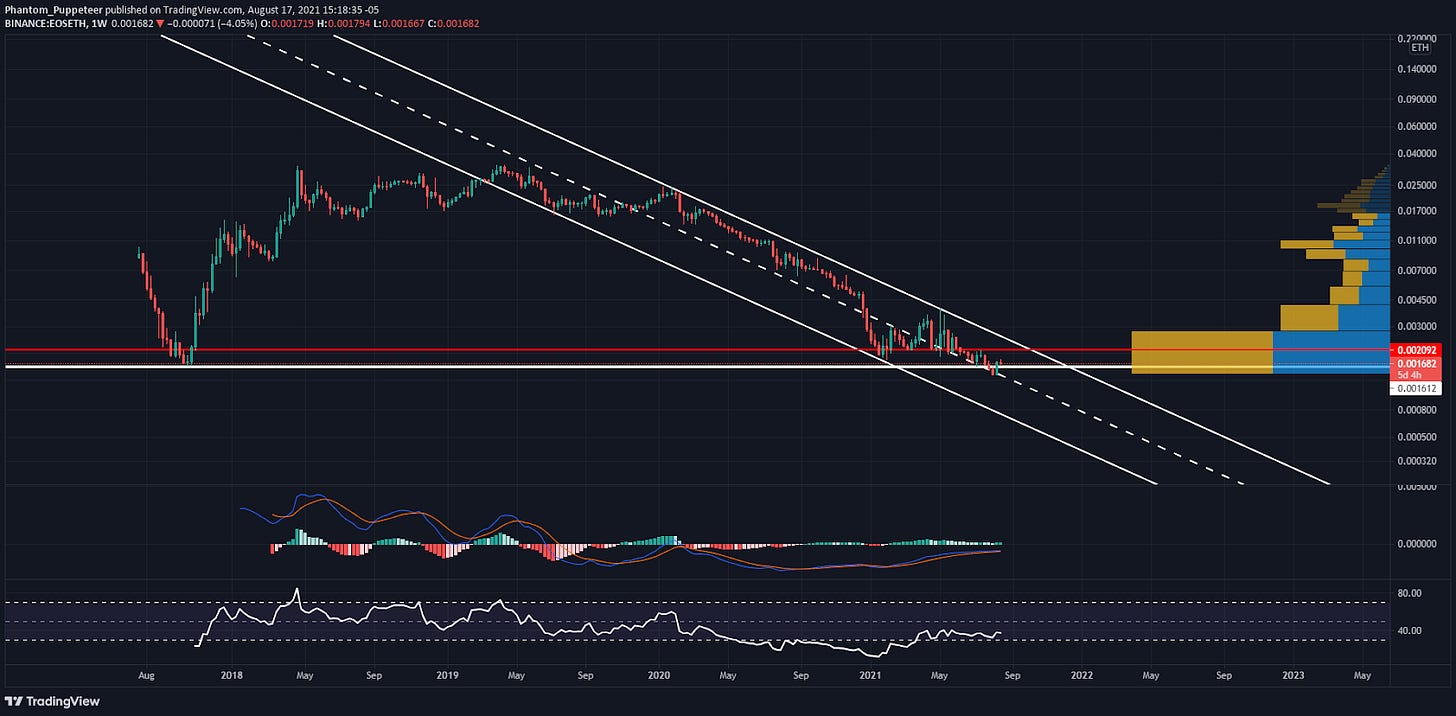
EOSETH - 1W Charts (Click to View)
For EOSETH weekly chart, in the last article we saw how it broke below the all-time low level and how it needs to close above it to signal a fake breakout to the downside:
Then two weeks later EOSETH went up to close above the all time low level. Now it has to maintain this level to start going up and potentially breakout of the falling channel which will be a very bullish sign:
Now to sum it up for EOSUSD, looking at the hourly chart we have to pay attention to the head and shoulders pattern and price being within the rising channel. If price decides to break these two patterns to the downside then we can expect price to fall to 4.60 - 4.43 USD. from the 4H chart we still have next target at 7.67 USD but if the hourly chart decides we should go down then on the 4H chart we might dip before going up again to the next target at 7.67 USD. On the daily chart we have a bearish signal on the RSI which could indicate a small correction before going up. And finally the weekly chart remains bullish and its macro uptrend is still intact.
Disclaimer:
Phantom Puppeteer is not a registered investment advisor, legal advisor, tax advisor, or broker/dealer. All investment / financial opinions expressed in any-and-all posts on this page, including screenshots & captions, are from the personal research and experience of the owner, Phantom Puppeteer, and are intended to be interpreted as educational material only. Although best efforts are made to ensure that all financial charts and commentary are as up-to-date as possible, there may be times where price moves beyond key levels before the chart can be posted. Alas, this is part of the fast-paced financial sector and cannot be avoided. Also, occasionally unintended errors and/or misprints may occur.
Find me on Twitter:
Learn how to earn…
Become part of our community.
Follow our socials.
Subscribe to our podcast.
Subscribe to this publication.
It’s free (for now)


Thanks for the EOS price updates.
I made trades using some of your previous analyzes.
Thanks for these and previous analysis.
Yesterday EOS was at 5.70 levels. I said maybe it would be 6 dollars today, but I saw it fell to 5.10 dollars. Since btc fell again, eos was affected by it.
Thank you for analyzing and informing us.