AotC - Risk Off > Risk On
Welcome back!
My last three episodes have been extremely accurate, and we’re just about perfectly where I thought we’d be at this point. I’m not just drawing fancy lines on the chart in this series… I am plotting probabilities. That is what Technical Trading is all about. I have successfully plotted these probabilities, and also successfully pointed out the “most probable” of them all countless times here on AotC. So much that it’s honestly impressed even myself, as I’ve never really had a medium to record my calls in such a thorough and referenceable way. I feel so blessed to be able to provide this to you all, and to continue to do so!
That being said, this is a bit of a turning point episode. We’re nearing a return to “Risk-On” once more…
In a Risk-Off market environment, people are sitting in Spot, trading less, and not using leverage (if not sitting completely in cash).
In Risk-On, market participants will slowly gravitate toward taking on additional market risk and in respect to crypto specifically, they heavily accumulate coins, thus forming a self-fulfilling prophecy and ushering in the bottom inadvertently. We’re nearing this “season” once more… I estimate by end of Sept., at the latest, we will be in Bull mode.
I’ve said it before, but I’ll say it again: humans drive the market, and humans need to heal from trauma regardless of how “hardened” we think we are, or how well we managed risk during former problematic market situations. We can’t just flip a switch and be bullish… Some will be ready sooner than others, but until the majority of the market participants are ready to move forward, the market itself won’t move forward (and those that were ready “earlier than the rest” will just get burned again). That being said, in all of June / July, the market was not ready, and anyone feeling ready got burned either for the first time or the second time since Black Wednesday in May where the market dropped 40-60% in a 24h period. The market is clearly taking its time until the majority of participants have recovered from that. Of course this was outlined in AotC as soon as it happened, so most of you were briefed on what to expect back in the end of May. We’ve just been biding our time, preserving what we kept aside, and awaiting our next move.
Let’s get into what we’re looking at right now through the rest of Summertime:
BTCUSD - 6H - click to view
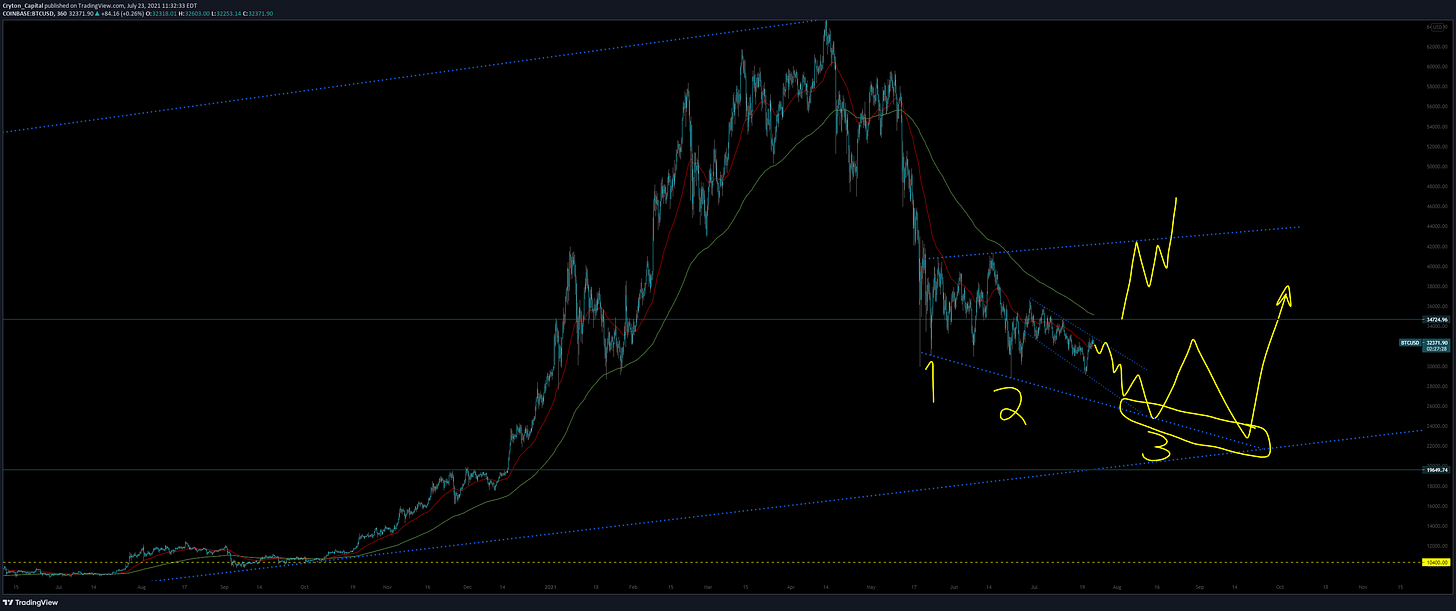
On BTCUSD, we’re in an Expanding Wedge formation that is an Incomplete Structure. This means we’re in an ever-widening structure that has yet to have 3 touches on any one boundary, but we do have 2 on each, so the boundaries and structure itself are confirmed.
I personally think we’ll get 1 more touch on the lower boundary first, but with the nice Bull Flag that we’re seeing here WITHIN the Wedge, we may break long first, re-test the top, then tumble once more shaking out the last of the weak hands before we finally move up and out of this Expanding Wedge. This is all healthy market behavior, and now that we have such clear structures across the board, we’re back into predictable territory. We can trade these structures now, and feel much more confident in our actions.
IF we get a 3rd touch on the bottom of the Wedge, I think that will be between $19k-22k, and it will bounce HARDD off that level. This will be your last chance to buy BTC at these prices. I’ve never once said that, ever, on any of my channels. But if we dump down to anywhere in the yellow-circled area in the screenshot above, I have confidence that area will never be retested again as long as we are all alive (pending some catastrophic hack or vulnerability).
ETHUSD - 6H - click to view
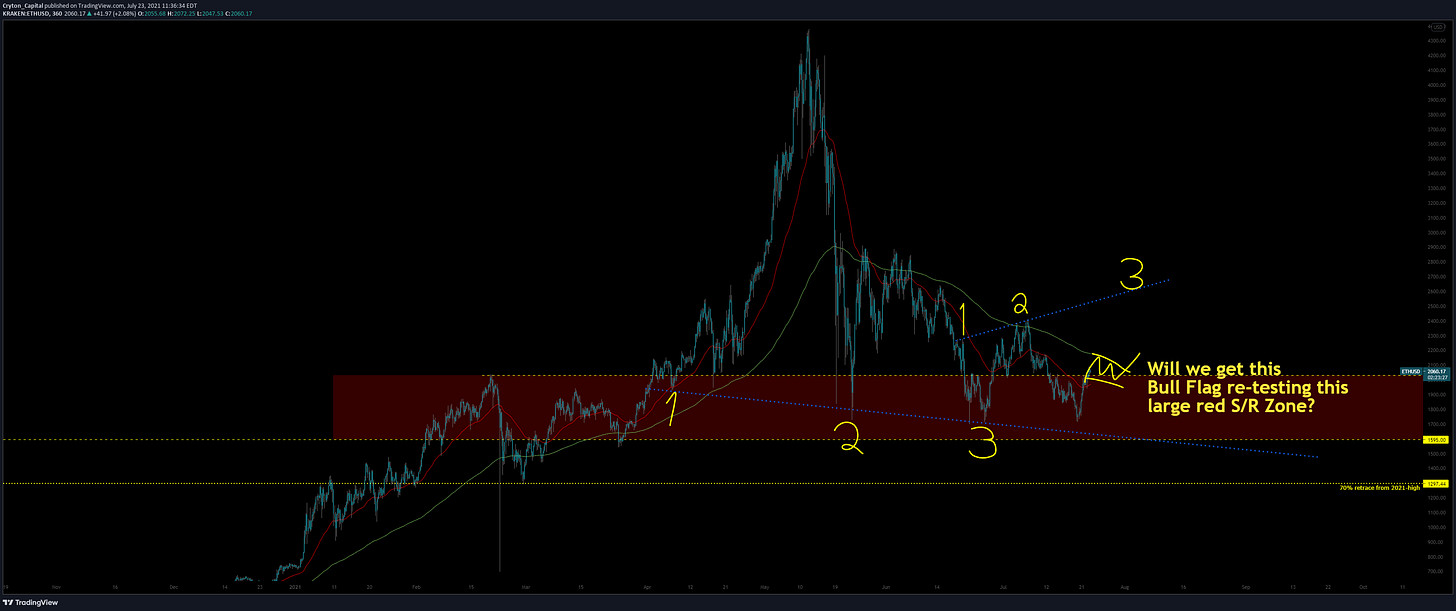
ETH is definitely looking way more Bullish than BTC here. We’ve already had a triple-touch on the trendline that’s supporting price right now, and the red rectangle is going to be acting as very strong support as well, as it has previously. If we get a little Bull Flag here, re-testing the 50EMA as new support, and the red rectangle as continued support, the aforementioned Bull Flag will form directly under the 200EMA; it’ll be a beautiful squeeze, driving price up through that 200 and toward the “3” on the screenshot above. If it gets there IMPULSIVELY, we’re good for a continued Bull Mkt. If we get there CORRECTIVELY, the whole thing turns into a Bear Flag, and we’re likely dropping right back down to that red rectangle again (from $2.7k back to $2k).
MATICUSD - 6H - click to view
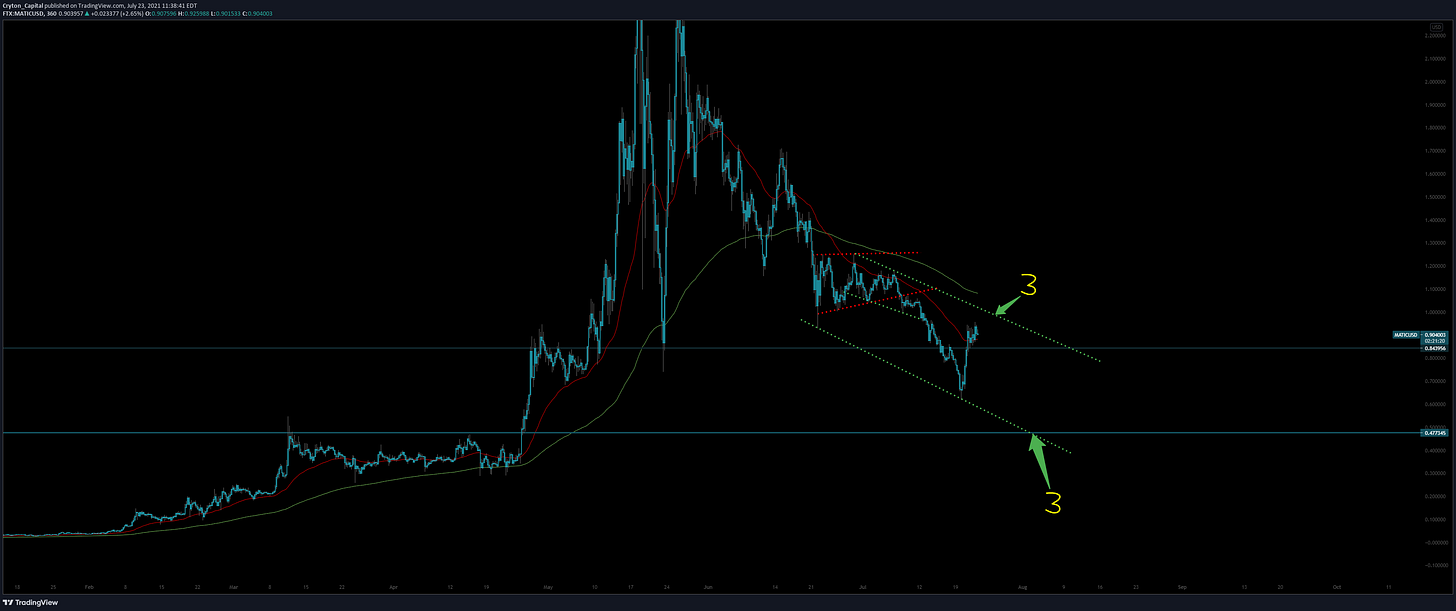
We dropped a little harder than I thought we would on MATIC, but very similar to ETHUSD above, we’re about to re-test the 50EMA as well as an SR line ($0.84) as support before heading higher. This chart is Bullish. I don’t believe we’ll get a triple-touch on the bottom of this Flag, (lower “3”), so if you’re looking to accumulate MATIC, I’d say this is a great spot for some DCA (dollar cost averaging). Keep your wits about you though, as the rest of the market may not be truly ready for the turnaround that MATIC seems ready for, and it may stay suppressed due to that fact. We’ll be tracking this continuously here in AotC as MATIC emerges as one of the strongest & most robust blockchains in the world.
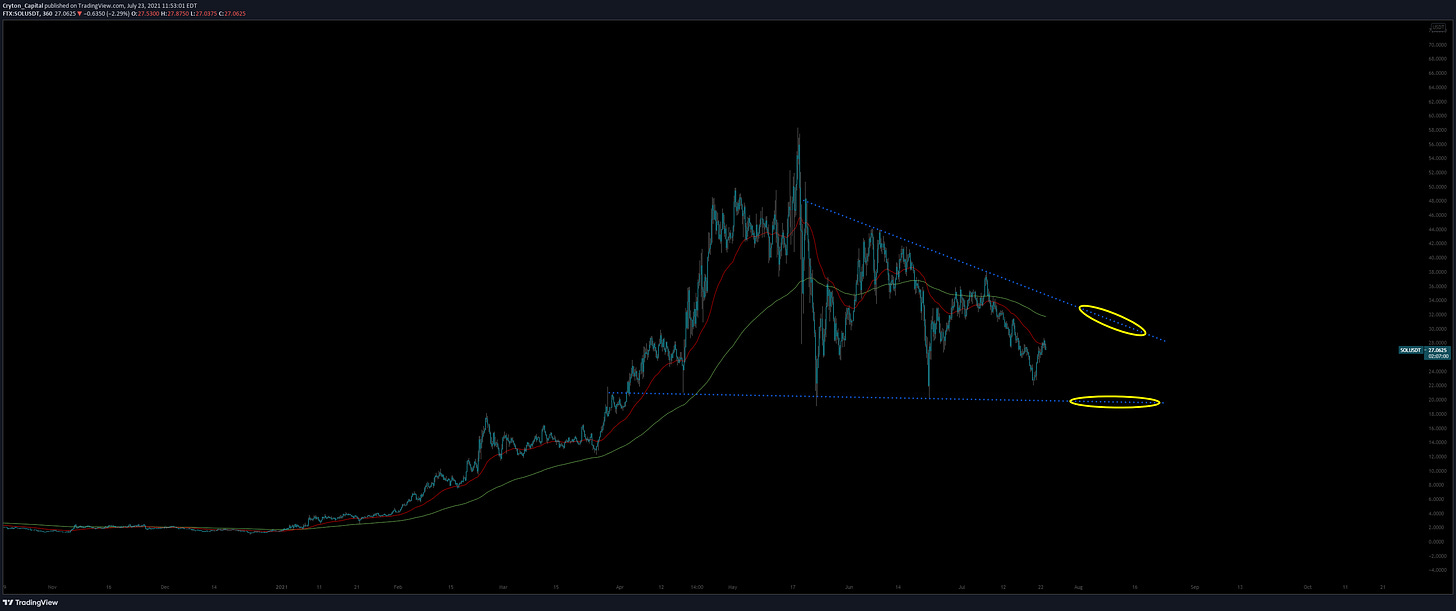
SOLUSD - 6H - click to view
Speaking of strongest & most robust blockchains in the world, SOL is hands-down one of the top 3 most bullish charts of this entire Bear market. It has displayed continued strength and endurance through EVERYTHING the rest of the market has been through… It’s very impressive. It’s also one of the last charts (if not THE last chart) that actually never broke structure, and has been in a massive Bull Flag the entire time!
What’s next? Either the lower yellow or the upper yellow. I’d say both are a 50/50 chance at a retest of either this point, as, in my interpretation, it’s very hard to identify if we’ve fallen Impulsively or Correctively from the upper boundary. That dictating how we’ll rebound, I won’t be trading this until I see a move up and a mini (Intraday) Bull Flag form (or) we move down to the lower circle where I’ll be heavily buying the bottom boundary re-test, if so.
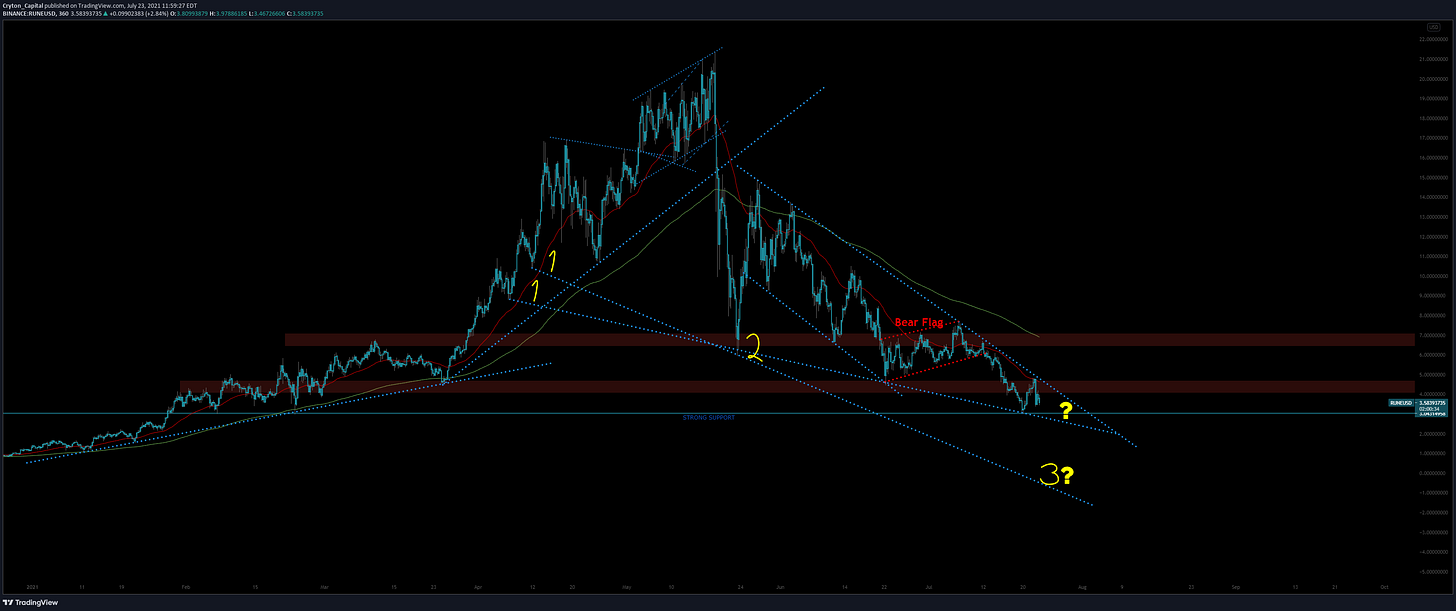
RUNEUSD - 6H - click to view
On RUNE, we’re in a structurally perfect Falling Wedge. We’re almost to the end, and we’re going to get squeezed out one way or the other. The break will be Impulsive. We’re either heading down to form the final (3rd) touch on the lower structure of the overall Descending Channel, or we’ll pop out above and the buy signal will be a tag of $5 and a Bull Flag forming, re-testing the red rectangle (S/R zone) between $4-5 as new support.
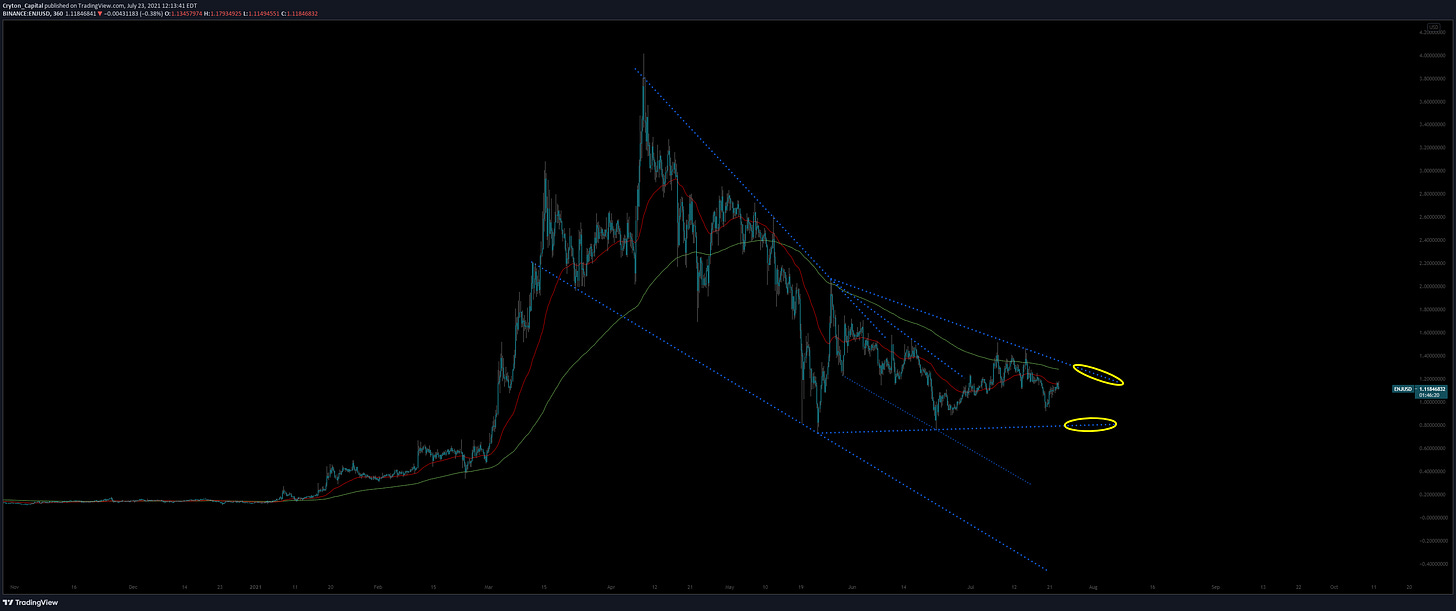
ENJUSD - 6H - click to view
ENJ is looking good. I think we’re going to break long from the Wedge we’re in here. It’s almost perfectly symmetrical, and although we are being suppressed by the EMAs, we’ve also fallen Correctively from the last re-test of the upper boundary. DCAing anywhere in here is fine, as ENJ is still one of my top picks and has exhibited some great strength lately. If you want to wait to see which yellow circle we re-test before you commit, that’s fine too. The market can remain irrational longer than you can remain solvent, so it’s best to follow your gut and not jump into anything you’re uncomfortable with. Remember: approach from a place of strength, as I mentioned in my last 2 episodes!
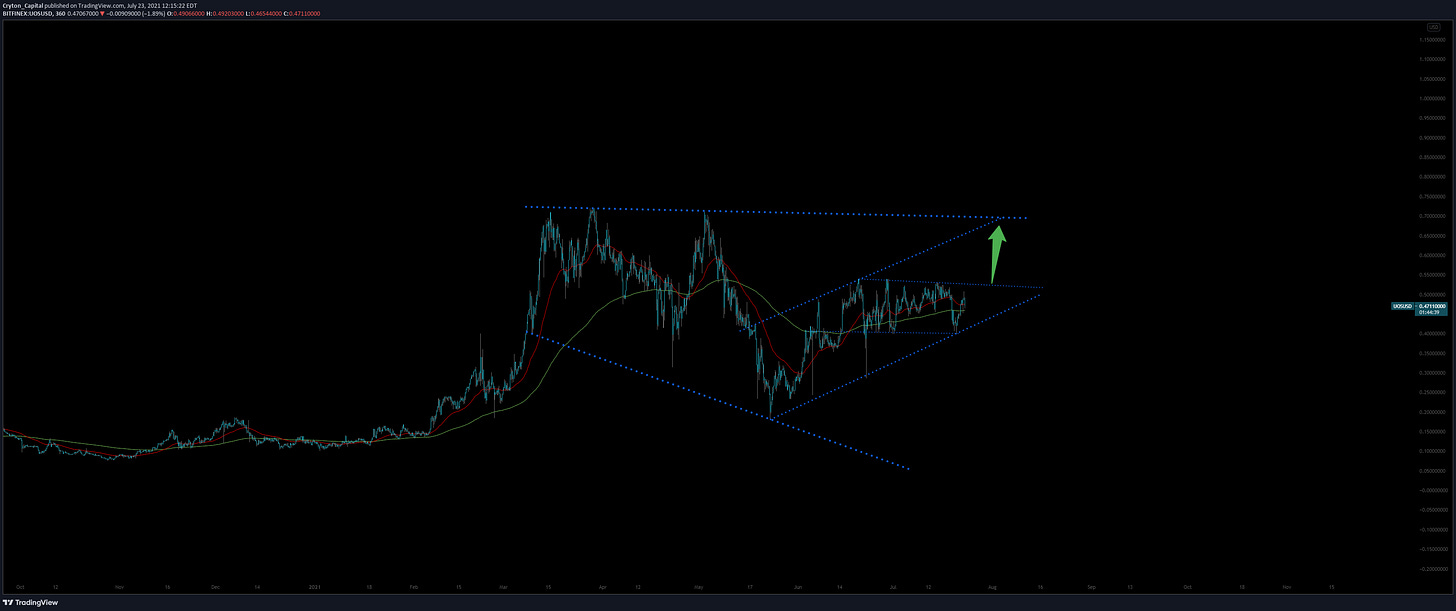
UOSUSD - 6H - click to view
On UOS, we’re in a Bull Flag that’s within a Rising Channel, and all of that is within an overall Expanding Wedge (or could be viewed as a Bull Flag). We work from the inside-out. Where are we at within all of this? The Bull Flag. We just re-tested the lower boundary of it, and what re-test number was it? 3rd. The strongest. So from here I believe we’ll be moving impulsively up to re-test the upper boundary of the overall Expanding Wedge where it intersects with the Rising Channel (green arrow). This may all sound confusing if you don’t have my screenshot up separately, so open it and you can see exactly what I’m referring to.
IOTXUSD - 6H - click to view
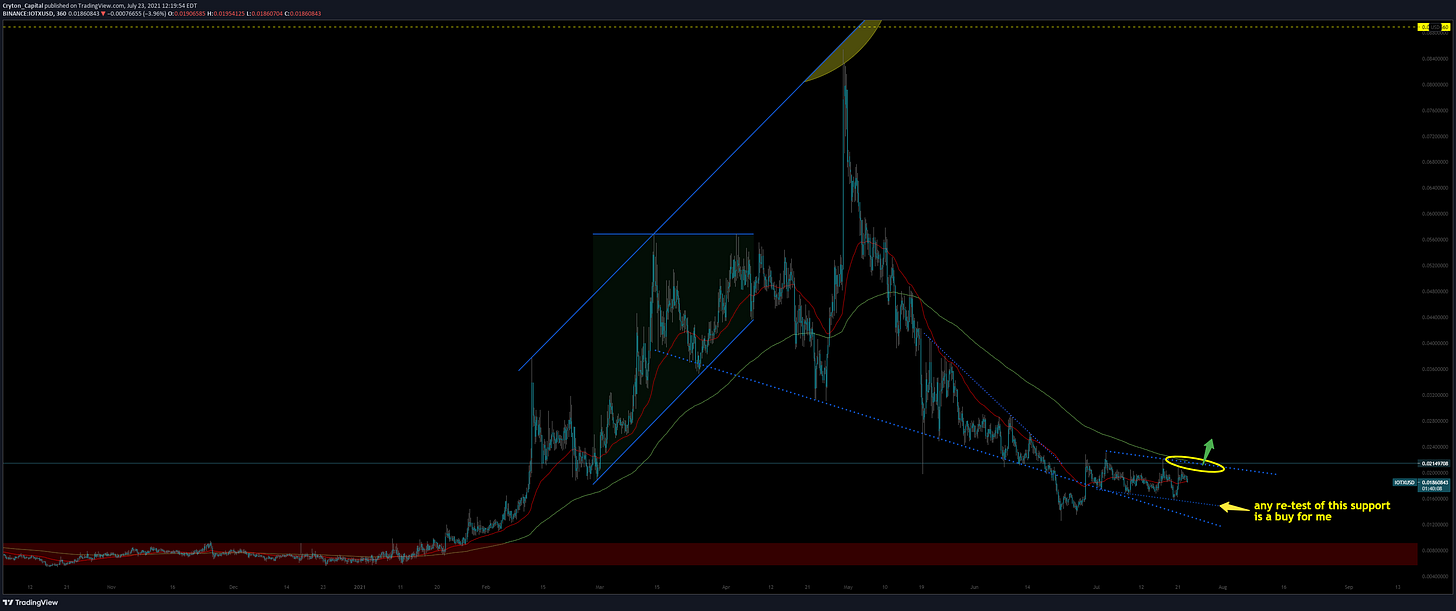
IOTX looking good here. We’re suppressed by the 200 EMA, but we’re re-testing the 50 as new support AS WE SPEAK; we’re in a mini Bull Flag here, so we’re looking good. I think we’ll likely Impulse long from this structure and then re-test the 200 as new support, just as we’re doing that now to the 50.
GRTUSD - 6H - click to view
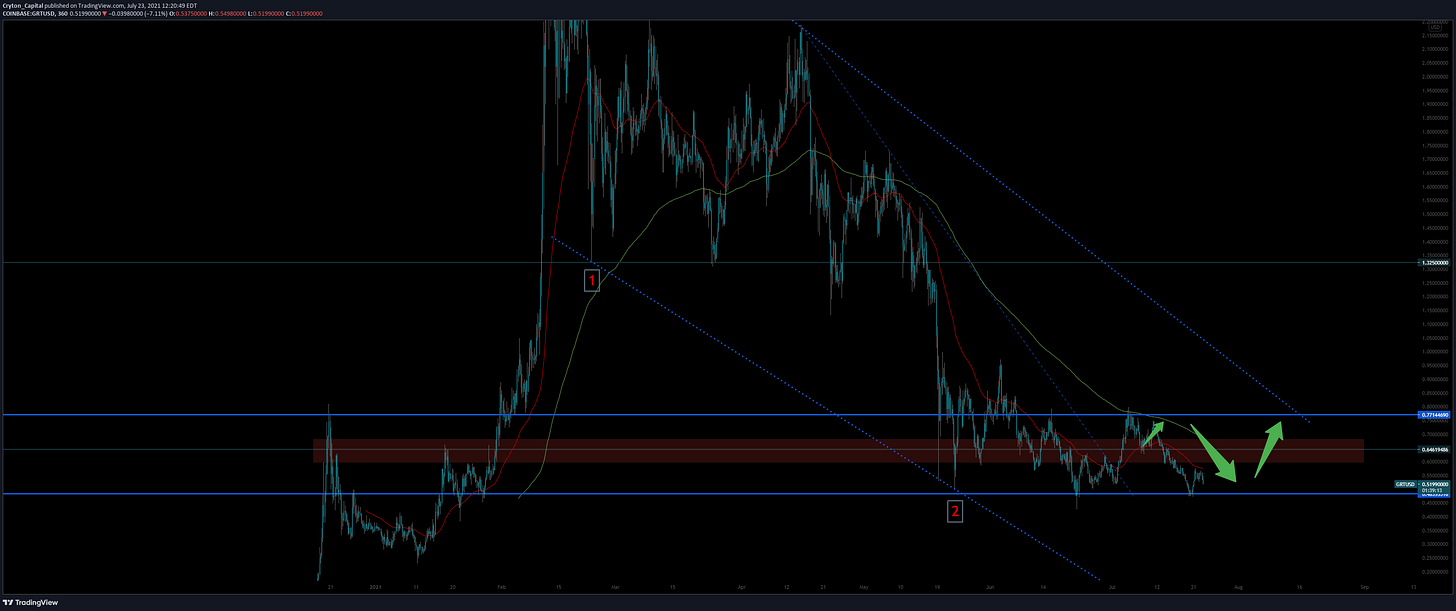
On GRT, we’re pinging within a range. It followed my green arrows PERFECTLY (outlined in Episode 22), and we’re headed back to the upper boundary now. You know what to do.
LTCUSD - 6H - click to view
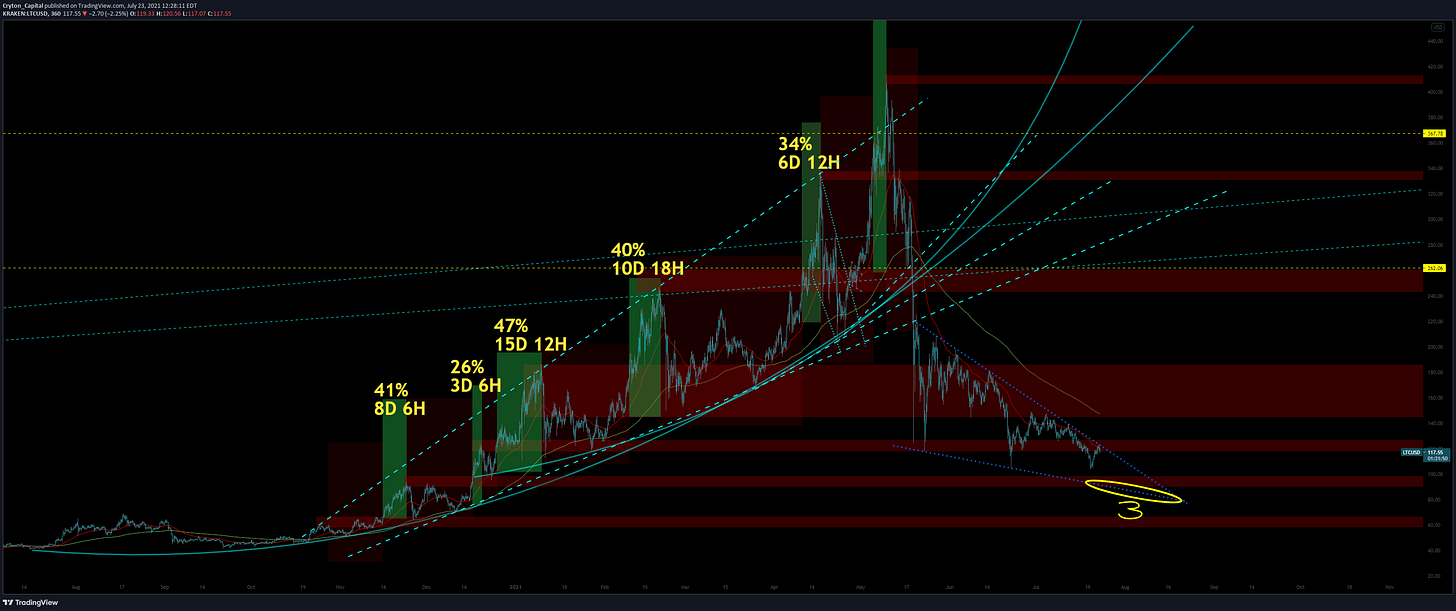
LTC, oh LTC… How much pain you’ve caused me. Alas, I’ll forgive you if you make me money again. As of right now, I don’t see that happening, however. I think we’re headed down to the “3”, signifying the 3rd touch of the Falling Wedge we’re in right now. That will be round-number psychological resistance of $100.00, too, which will likely be the real floor.
LUNAUSD - 6H - click to view
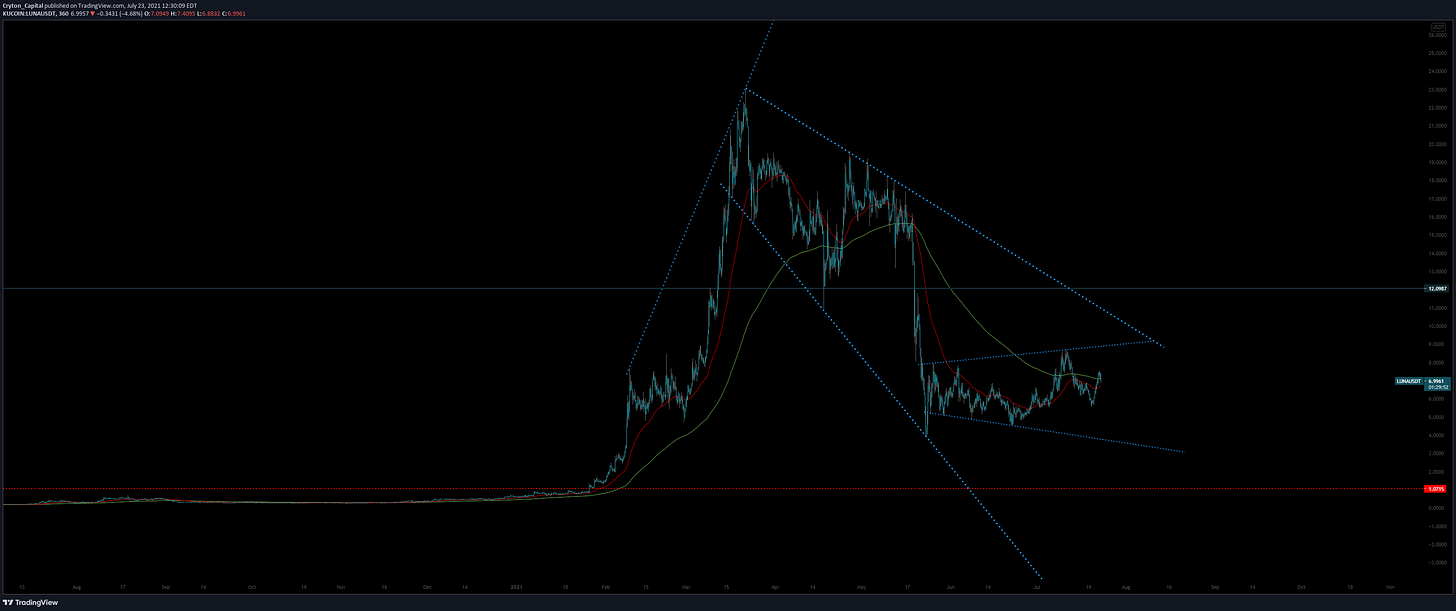
Expanding Wedge within Falling Wedge. We’re looking at a re-test at the third touch of both Wedges’ upper boundaries. This will cause LUNA to fall pretty hard once more, being the 3rd touch of TWO key Trendlines, as well as the completion of the structure it’s currently in (bearish). LUNA has been a pain to trade, but taking this up to the $9 range on a bounce of these EMAs seems to be a pretty straightforward play for now.
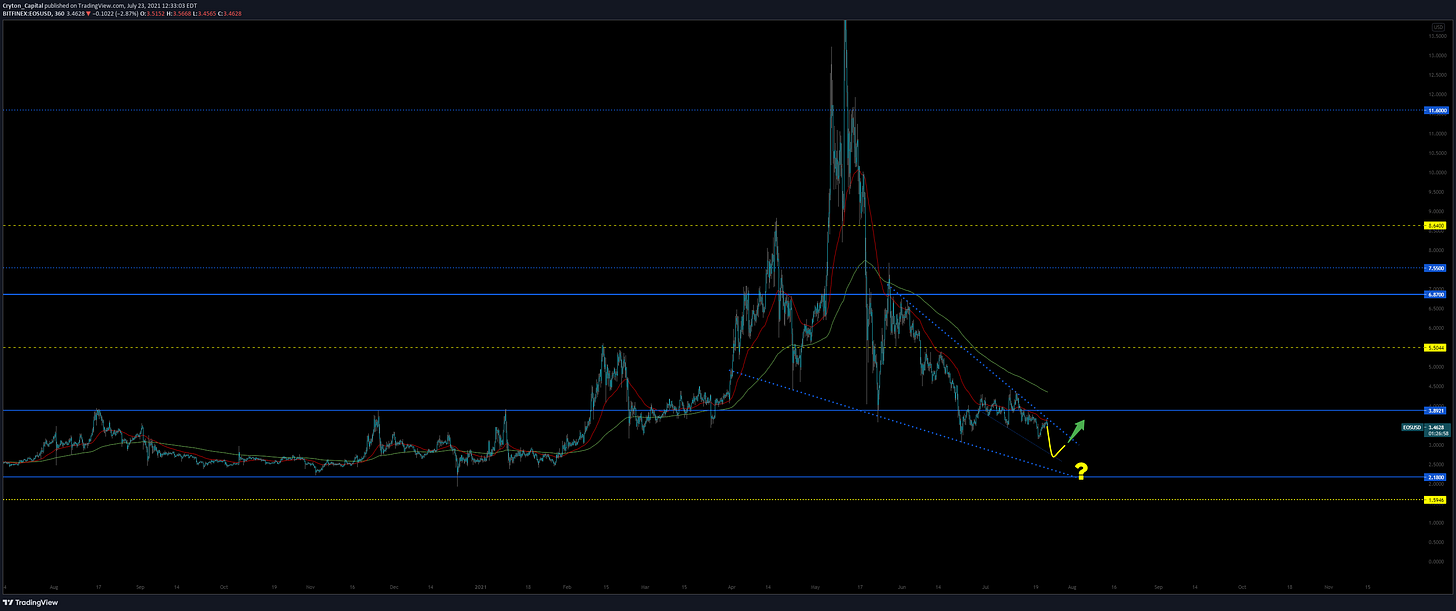
EOSUSD - 6H - click to view
EOS, oh EOS… How much pain you’ve caused me. Lol, just kidding. I’ve approached this pair with nothing but caution, and am continuing to do so. One of my first and only criticisms of AotC was that I wasn’t more bullish on EOS. I guess I like making money too much… Jokes aside, we’re looking like a triple-touch (AKA, 3rd touch incoming) of the lower boundary of this Falling Wedge structure we’re in, landing us about $2.70. I think “up” from there, as the descent has been Corrective in nature thus far (Bullish).
I preached Risk-Off in the end of May, and extreme caution.
I preached continued caution & patience all through June and July, frequently stating I was in spot or cash.
Now we’re NEARING Risk-On. NEARING. If you would like to start to DCA now that we’ve shown a little strength on most of these pairs, I think that’s fine. I’m still trending toward shorter-term plays as we’re still in larger overarching structures market-wide.
HODLers, keep HODLing! We’ll come out the other side of this, and crypto will eventually enjoy the rays of summer once more, warming it’s face to the public and our wallets into the future.
Disclaimer:
Cryton Capital is not a registered investment advisor, legal advisor, tax advisor, or broker/dealer. All investment / financial opinions expressed in any-and-all posts on this page, including screenshots & captions, are from the personal research and experience of the owner, and are intended to be interpreted as educational material only. Although best efforts are made to ensure that all financial charts and commentary are as up-to-date as possible, there may be times where price moves beyond key levels before the chart can be posted. Alas, this is part of the fast-paced financial sector and cannot be avoided. Also, occasionally unintended errors and/or misprints may occur.
Learn how to earn…
Become part of our community.
Follow our socials.
Subscribe to our podcast.
Subscribe to this publication.
It’s free (for now)


I'm new here. Therefore, this is my first episode actually. :D I enjoyed a lot while i was reading your article.
I'm gonna read your other episodes as well. I think I do it reversely. :D
Especially ENJ, SOL, GRT, EOS, coins I follow. That's why I'm looking forward to the continuation of the series.
Thank you for these informative analysis, Chris!
Reading your comments are like reading comics, I enjoy them a lot, especially when I see the coins I'm familiar with. I will be following your analysis closely for ENJ, SOL and EOS.
Hope to see you for next episode, and I wish you will bring more of those. Thanks!