Art of the Chart - TAking Requests!
Hey all!
Markets are looking a little questionable right now, and a few of the more bearish scenarios that I outlined in my prior episode have been coming true, so I have been on the sidelines. The two positions I continue to hold through it all are RUNE and SPELL, because they’re too bullish in the face of anything that could happen for me to sell them. Otherwise, I’m in USDT.
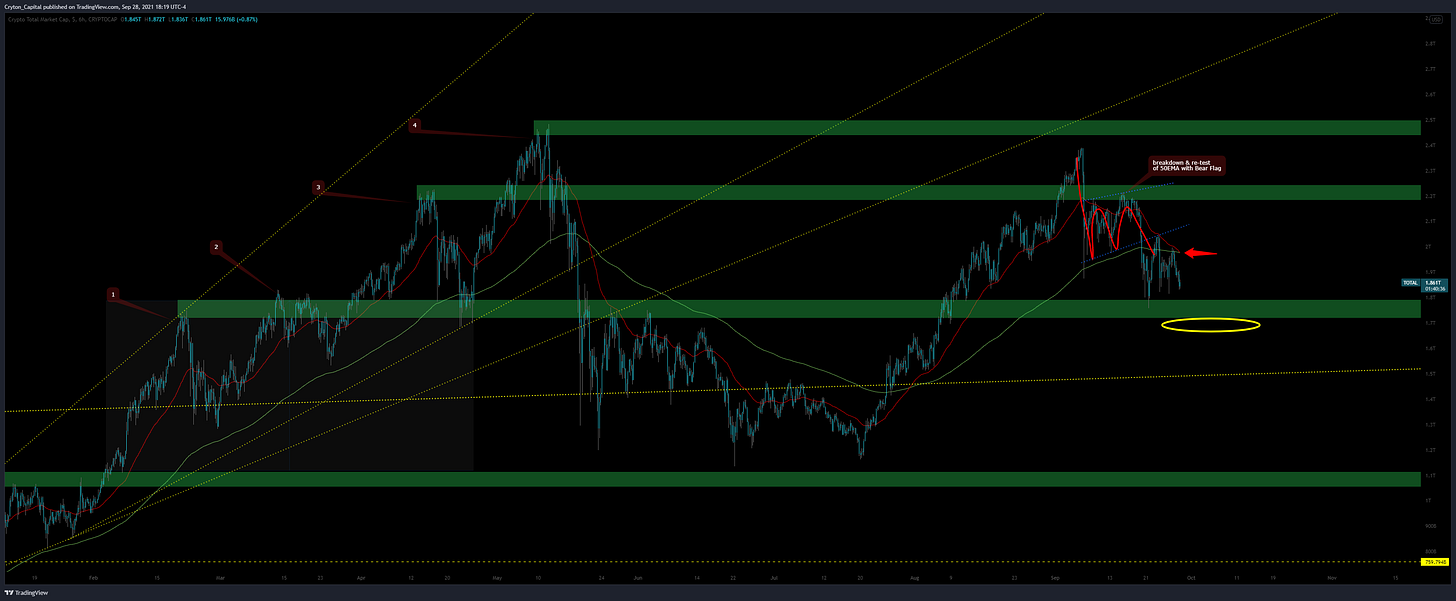
Total MC 6H - click to view:
For total MC, I pointed out the Bear Flag and estimated a breakdown after the Impulse Short from the double-top & following retest & rejection of the UNDERside of the green S/R level (red callout box pointing that out). Indeed, price followed suit and broke down from that flag, and now we’re in what looks to be another Bear Flag with an impending Death Cross (50EMA closing over 200EMA) on the 6H. We are hovering over the next S/R zone (middle green rectangle) which is currently providing support, but if we get a SINGLE 6H candle that closes below this green rectangle, I’d be exiting the majority of your positions regardless of how high-conviction they are. We’re in a weird spot here where, if you haven’t sold yet, it’s not worth selling until we see if we get a more confirmed breakdown from here, and luckily, the “line in the sand” is very obvious: this green S/R zone.
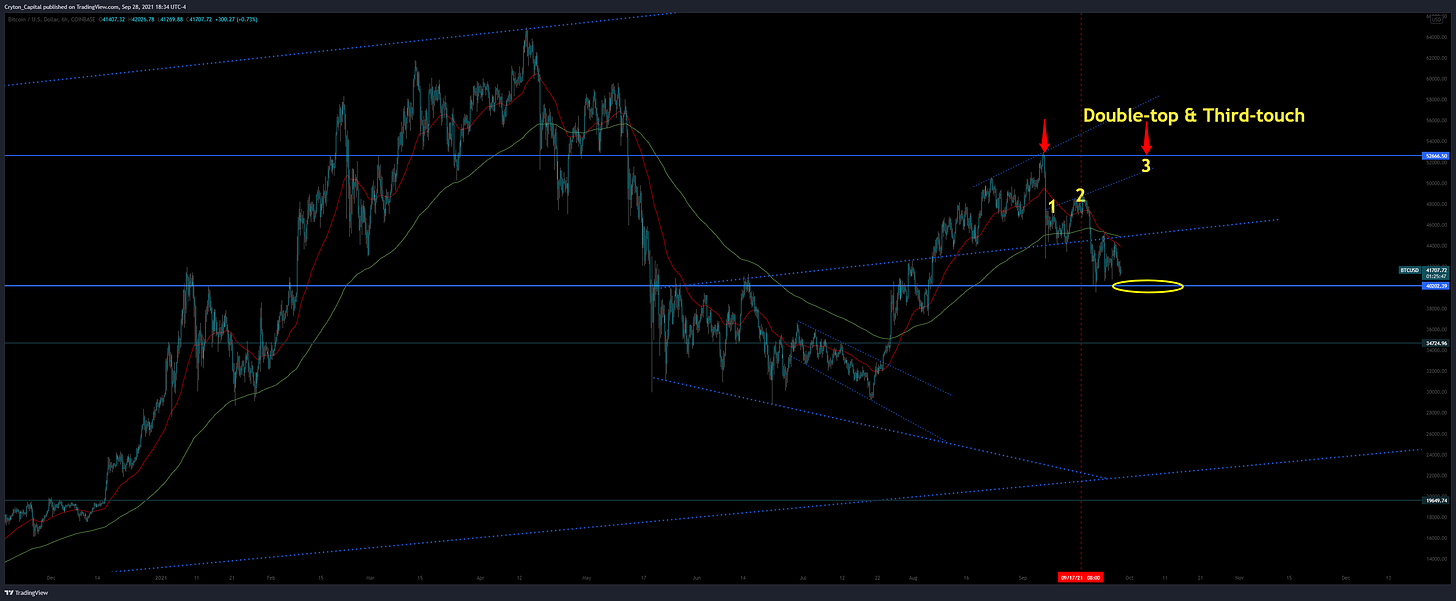
BTCUSD 6H - click to view:
This chart - BTCUSD - is about the same as the Total MC chart, but more clearly displays why half of CryptoTwitter is calling for $38k lows right now. I called for a drop where the red vertical line is, and we got it. I thought it would be more of a corrective drop, however, and that we’d get an impulse up to a Double-top (2nd local high) area, which would also coincide with the third-touch of the Trendline there, then pull back from there. That hasn’t happened yet, alas, it doesn’t mean it won’t. Perhaps we’ll Impulse up, all of CT will get on the Bull train again, then we’ll reach that Double-top area and have another 15-20% drop back to local-lows, causing more pain in the markets. I know this isn’t what you want to hear right now, but until we get out of this ranging area, this is what the market is apt to do: find new ways to cause pain. If you’re uncomfortable with that, there’s a reason. With 99.9% certainty, it’s because you’re in things that are too risky for the current market environment. Scale that risk back a little and sell just 25% of a coin you feel is your ‘riskiest’ position. I bet you’ll immediately slide right back into that comfort level where you’re able to more easily have patience for what the market does next. You might even feel so good, you sell the rest of it!
ETHUSD 6H - click to view:
ETHUSD looks really quite bad here. I know… more bad news…
I expected we’d hit the double-top area (lower red arrow) or run up and even hit the previous ATH area for a more massive double-top (higher red arrow), but we never did. We just got a Bear Flag breakdown, leading us into a 2nd Bear Flag. We’ve even closed below a decently strong S/R level: $2900. This opens up the range of where price could go quite drastically, esp. with the confirmed Death Cross; those EMAs will contain price under them until we get bullish enough to break up through once more.
Summary:
Overall quite bearish here. To reiterate, I’m in spot on SPELL and RUNE, and USDT with the rest. I think we might even see a significant LUNA dump even in the face of the Columu5 mainnet upgrade, and it could get nasty because there are sooo many long as heck on LUNA right now. Are we long-term bear here? No. But it’s quickly turned from short-term to medium-term.
Stay protected, tune into your own unease (if present) and balance the equation however you need to; consider my recommendation above of selling 25% of your riskiest asset to a stablecoin, and see how you feel!
Until next time: you know what to do! Toss those requests for the main episode in the comments below!
Disclaimer:
Cryton Capital is not a registered investment advisor, legal advisor, tax advisor, or broker/dealer. All investment / financial opinions expressed in any-and-all posts on this page, including screenshots & captions, are from the personal research and experience of the owner, and are intended to be interpreted as educational material only. Although best efforts are made to ensure that all financial charts and commentary are as up-to-date as possible, there may be times where price moves beyond key levels before the chart can be posted. Alas, this is part of the fast-paced financial sector and cannot be avoided. Also, occasionally unintended errors and/or misprints may occur.
Follow Me.
Learn how to earn…
Become part of our community.
Follow our socials.
Subscribe to our podcast.
Subscribe to this publication.
It’s free (for now)


If possible, can you look at ftm? Thanks
If possible, can you look at ftm? Thanks