Before we go through this article, I would recommend reading my previous weekly article EOS Price Update 07/26/2021 to have a better understanding on how price reacted up to now.
As I always do in these price updates, I first start with short term analysis zooming out to larger time frames. So, let’s start with the 1H chart analysis:
EOSUSD - 1H Charts (Click to View)
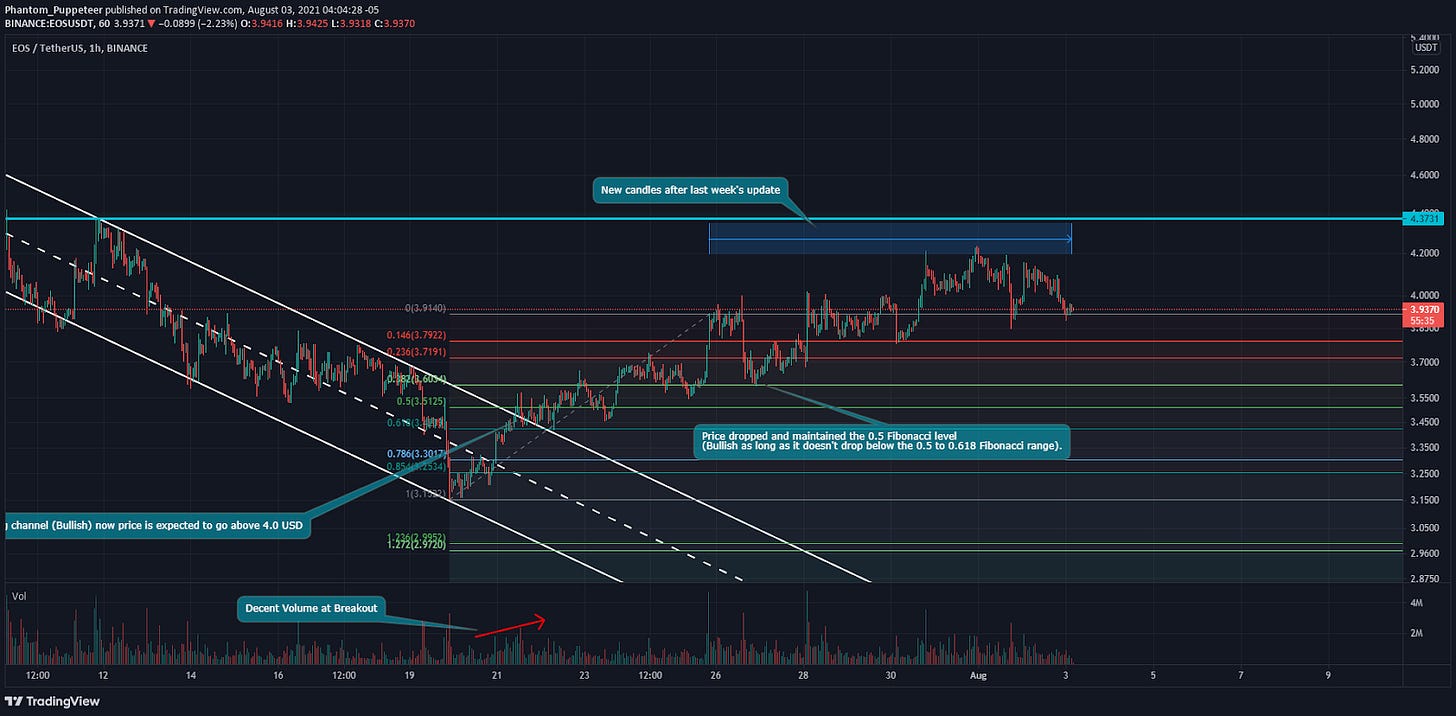
Referring to last week’s article, EOS broke out of the falling channel and since then, it has been constantly going up at a slow pace. A small correction was expected to happen without price falling below 0.5 - 0.618 Fibonacci range as shown in last week’s chart:
After one week, EOS is still going up and approaching the strong resistance at 4.37 USD:
However, there is one bearish sign on the hourly chart that must be addressed. As can be seen on the chart below, the price has formed a head and shoulders pattern near the strong resistance at 4.37 USD. It is important for the price to stay above the neckline (yellow line) in order to resume its bullish trend. Otherwise, EOS might experience a short term bearish movement towards 3.50 USD. Readjusting the Fibonacci levels from lowest point to recent highs, it shows that EOS must not fall below the 3.50 USD which is in the Fibonacci range of 0.5 - 0.618 otherwise, the bullish trend will be invalidated.
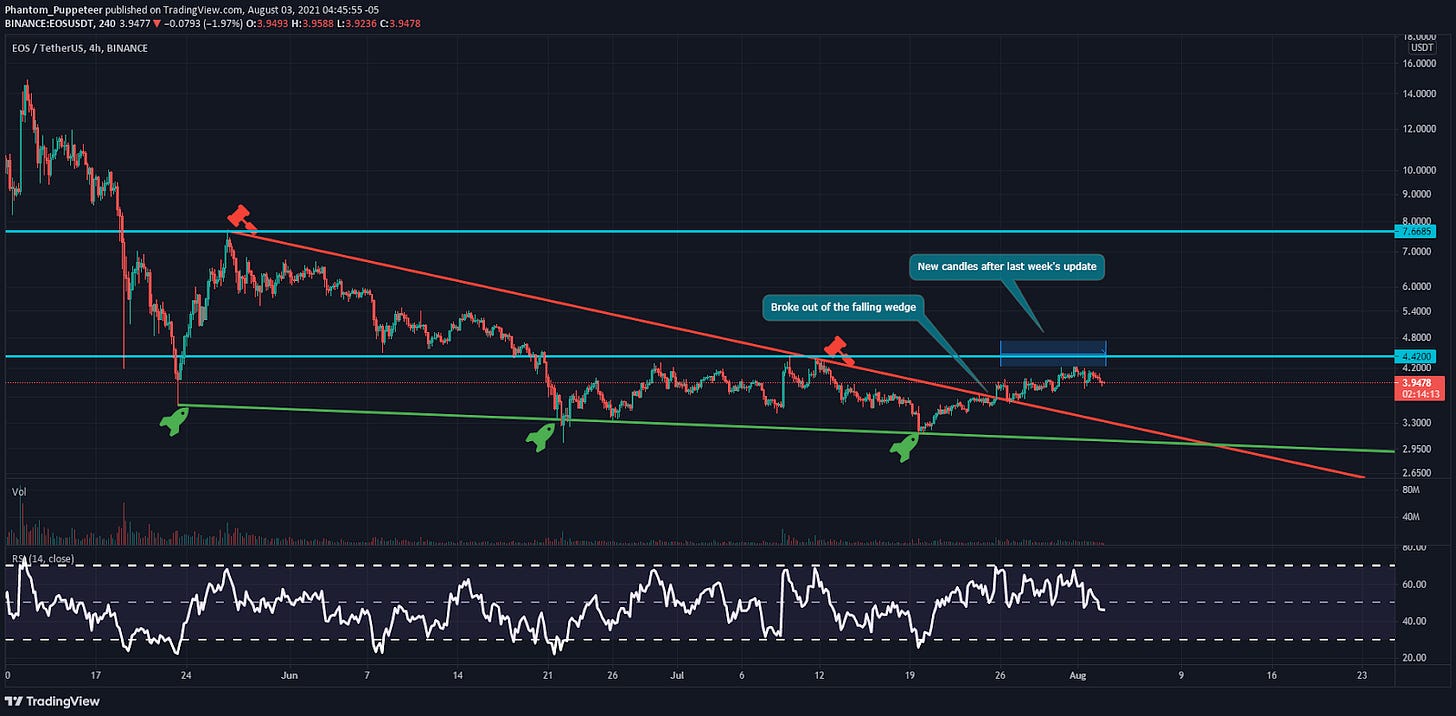
Referring to last week’s article, we can see on the 4H chart a large falling wedge “Ending Diagonal” forming and price broke out of it with large volume as seen below:
EOSUSD - 4H Charts: (Click to View)
One week later, price retested the upper wedge line and remains bullish as long as price stays above the wedge line. Bullish target remains at 4.37 USD then 7.65 USD where strong resistances are:
Combined with what we saw on the 1H chart, in case H&S pattern plays out, EOS might go down to touch the red upper wedge before going up again. Bullish trend is intact as long as the price is maintained above the wedge formation.
Now, referring to 12H chart, in last week’s article we identified a bullish divergence on MACD as shown in the chart below:
EOSUSD - 12H Charts (Click to View)
After one week, the MACD indicator crossed the 0 line and turned bullish. RSI indicator is also bullish since it is above the 50 mark:
Combining this with the conclusions we have from 1H and 4H charts, in case price decides to drop towards 3.50 USD, then the 12H chart MACD and RSI have to stay above 0 and 50 levels respectively to maintain the bullish trend otherwise price might go further down.
Now, on the macro scale, the weekly chart, there is no update on EOSUSD nor EOSBTC pairs. However, on EOSETH pair, the price broke below the all time low level as shown below:
EOSETH - 1W Chart (Click to View)
This seems like a bearish sign on the weekly chart of EOSETH. However, in the coming few weeks price has to close above the all time low level to make it a fake breakout, otherwise EOS price will continue to lose momentum against ETH.
In my opinion, EOS might have a short term correction as seen on the hourly chart if the neckline of H&S pattern broke and price headed towards 3.50 USD. On the macro weekly chart of EOSUSD, it still remains bullish biased with the higher lows and higher highs trend intact. EOSBTC chart still remains bullish as long as price is hovering around the upper trend line. On EOSETH chart, price has to close above the all time low in the coming few weeks to make it a fake breakout “Similar to what happened with EOSBTC when price went below all time low then rebounded fast”
Disclaimer:
Phantom Puppeteer is not a registered investment advisor, legal advisor, tax advisor, or broker/dealer. All investment / financial opinions expressed in any-and-all posts on this page, including screenshots & captions, are from the personal research and experience of the owner, Phantom Puppeteer, and are intended to be interpreted as educational material only. Although best efforts are made to ensure that all financial charts and commentary are as up-to-date as possible, there may be times where price moves beyond key levels before the chart can be posted. Alas, this is part of the fast-paced financial sector and cannot be avoided. Also, occasionally unintended errors and/or misprints may occur.
Find me on Twitter:
Learn how to earn…
Become part of our community.
Follow our socials.
Subscribe to our podcast.
Subscribe to this publication.
It’s free (for now)


Whatever happens to its price, EOS is continuing to build steadily. Every week we see stuff happening regarding to EOS. It seems like more than alive, so there's nothing to be worried about. I think it will make a move on ETH chart and break the shown line upwards.
I like the small comments you make in the charts, they help to understand better what you are trying to tell.
Thank you for the review! I'm thinking to accumulate more EOS soon when I will find the chance.
EOS will break the $4 resistance andnext $4.3will continue to rise after testing its resistance
looks like.And with a later fixI don't think it will go below 3.6.
All looks good for EOS.
I hope it catches the power to break the high resistances.